Indicators for Binary Options
With all its obvious advantages, trading is still not an easy job, which boils down to tracking the dynamics of an asset and profitable entry into trading to make a profit. Carefully studying the state of the market, using a huge set of data, traders use all possible tools – brokers’ signals, reviews, forecasts, strategies. The first thing a newcomer gets to know about the market is indicators. Sometimes, indicators are the first thing a newcomer to the market gets to know, the first source from which he gets his first signals. Professionals, on the other hand, have come a long way in binary options trading. The indicators that can generate signals depend on the market situation and the type of asset, expirations, etc. What are these indicators? Let’s learn more about them below.
Contents
- 1 When Did the Indicators Appear?
- 2 Types of Indicators
- 3 What Are Indicators for Binary Options?
- 4 How Is a Deal Formed on the Binary Options Market?
- 5 How Is a Deal Formed on the Forex Market?
- 6 Platforms with Indicators for Binary Options
- 7 How Are the Indicators Used in the Broker’s Terminal?
- 8 What to Do If the Platform Does not Have the Right Indicator?
- 9 How to Add an Indicator to the MetaTrader 5 Chart?
- 10 How to Get Signals for Trading Based on Indicators?
- 11 Binary Options Indicators
Indicators are tools that automatically perform calculations based on a formula using chart indicators and user settings, and display the results. These tools are part of the technical analysis tools and usually have a graphical representation, such as histograms or lines. When selected from the list of available indicators in the terminal, they can be added to the chart instantly. Indicators do not work randomly and thoughtlessly, they are based on complex formulas, they are even, if I may say so, real intelligent machines that simplify a trader’s work by automatically carrying out complex calculations and constructions. Today, traders can get signals by simply adding an indicator to their chart and start trading. This instant access to the data on the chart and convenience make indicators especially attractive to traders.
Top 5 best binary options brokers: test their terminals
| Broker | Bonuses | Open an account |
|---|---|---|
|
1
|
50 %
Bonus on the deposit of $100 and more – via promo code WELCOME50
|
Start |
|
2
|
5 %
Bonus when depositing in USDT (TRC20)
|
Start |
|
3
|
Cashback
Refunds of commissions, spreads and other costs
|
Start |
|
4
|
15 %
Bonus of 15% on deposit with promo code iCGSbEgiAR
|
Start |
|
5
|
100 %
First deposit bonus
|
Start |
When Did the Indicators Appear?
Indicators could not appear out of nowhere, these tools of technical analysis were the result of the hard work of financiers, analysts, and traders, who worked much harder to get signals to enter the market than they do today. Market trading existed long before computers. In those times before the determination of asset dynamics, traders made calculations of huge amounts of data, kept records, trading statistics by instruments, and built tables and charts by themselves.
Then the rapid computer age began and it turned out that the most complex calculations, which took a lot of time, could be entrusted to a machine and it would quickly and accurately provide the results. Further, the spread of the World Wide Web led to unique and grandiose consequences – now, sitting at home at the computer, the trader has access to a database of indicators, for example, available in the terminal, can literally in one click add them to the chart, combine several indicators and already on their basis draw conclusions about the dynamics of assets.
In addition, some terminals allow you to add to their libraries of indicators and whole trading systems, consisting also of author’s tools, which, thanks to the powerful development of the Internet, is becoming numerous. Traders all over the world are joining communities, where market professionals develop indicators and share the results of their work with interested subscribers, having much more possibilities than before. Today, it’s easy to track the appearance of new indicators online, which you can download from the author and install on your platform. By processing huge amounts of data in a few seconds, the indicators give traders a hint about the possible price dynamics.
Now, most traders trust indicators, although some of them use in their work more data from the fundamental analysis, criticizing the indicators. But it should be understood that the indicator is not an ideal tool, because it can lag behind with signals, it does not predict the exact future of the asset, but only predicts the possible dynamics of the asset based on historical price and volume data. In addition, it is possible and even recommended to trade different instruments in the market, depending on your trading style and type of instrument.
All analysts, forecast writers, and trading gurus today use indicators. Starting their first steps in the market, players get acquainted with the simplest tools of technical analysis, which are more accessible and understandable to them. Often both beginners and professionals ask themselves a question: which indicator is better, and which one should be used for a certain situation? Let’s discuss it further on.
Types of Indicators
These days, there are many technical indicators available online – more than 2000 free tools and this is only in the MetaTrader 5 system, which contains several options for finding and adding them (Internet, library, market, custom script ordering). New tools appear in the community every day. The “live chart” library also contains thousands of different instruments, both author’s and popular ones. How many indicators are there in the market right now is a difficult question, there are indeed a lot of them, but traders should understand that this is not the main thing here, but that they have to determine for themselves a list of convenient and effective tools, which can be used in different situations and still be profitable.
The effectiveness of such tools is assessed differently by analysts. It is worth understanding that there is no universal indicator in the market that can help a trader in every situation, so there should always be a set of indicators in their arsenal. There are several classic and basic indicators that most players are familiar with – popular tools, such as MACD, Bollinger Bands, the Stochastic Oscillator, and RSI, among others.
It is easy to understand how common a particular indicator is among traders, which tools they trust most of all, which, in their opinion, is the most accurate in its predictions. Also, there are more complicated tools, used by professionals, which require more knowledge and skills. Some indicators are easy to find on the Internet and are free to use, others, on the contrary, are less popular among the players, because it is necessary to pay money for their installation, and not always small. Traders need to understand that there is a classification of indicators which makes it easy to see their features. Thus, indicators can be divided into such groups:
- Trend indicators
They can determine the direction of the trend at a given minute and notice its reversal in time. Such instruments line up on the chart parallel to the price, can cross with it and change their position, signaling a change in the trend. They are used for determining the trend – the signal of a transaction opening in a certain direction, in order to enter or leave the market on time. When the price turns, changing the direction, the trader closes the position preventing possible losses. This is, for example, Moving Average, ADX, MACD, etc.
- Indicators-oscillators
These tools are the second most popular group of technical indicators, which are also common among traders. Once they are added to the chart, they are displayed in a separate window, their readings are relative and are based on price data, but their own readings do not correspond to price data, they usually fluctuate in a specific range, for example from 0 to 100, from +100 to -100. Relativity of data is their main difference from trend tools, and a number of effective trading strategies, such as divergences, are built on it. Oscillators are used to find the moments of overbought and oversold, the strength of the trend. If indicators of the previous group determine the time of transaction opening, the oscillator, apart from this information, can help to see the moments when it is better to refrain from trading, and this is, of course, invaluable for a trader. These include CCI, RSI, Chaikin Oscillator, Stochastic, RVI, McClellan oscillator etc.
- Volume indicators
Such tools make it possible to determine real trading volumes, players’ interest in a particular asset, see what caused the interest in the asset – manipulation or the real interest of investors. Some of them determine the tick volume – that is, the frequency of price dynamics at a certain time. They can be used to assess the intensity of trading, but they do not provide information about the volume of money. Some brokers of binary options have their own indicators of volumes, which help them to see an objective picture of the traders’ positions, but do not have data on the state of the market.
- Channel indicators
These tools work in such a way as to set the boundaries of price dynamics in order to identify its reversal points. They are equally effective during a flat (resistance/support levels) and during a trend. Among such tools the most popular are Bollinger Bands, Envelopes, Keltner Channel, Donchian Channel.
- News indicators
These are tools that allow you to conveniently follow the news changes and not to miss the moments that would bring players substantial income. These are authoring tools such as Urdala news, NewsInfo, NewsCal, etc.
- Level indicators
As you know, levels are essential in binary trading. Thanks to the definition of levels it is possible to determine where reversals or strengthening of the trend are possible, which is also used in trading. Such tools include, for example, Barry, Fractals, Murray levels, Zone, etc.
- B. Williams indicators
In the terminal MetaTrader 4 (and MT5) it is customary to single out as a separate group those tools created by Bill Williams. They are very popular with players and are often found in strategies. These are Fractals, Gator, MFI, Alligator, Awesome Oscillator, Acceleration/Deceleration.
What Are Indicators for Binary Options?
The options market is impressive in its possibilities. Here one can get the result that the player himself would like, without spending a lot of time on work, one can improve his experience, participate in competitions, etc. To a large extent, the effectiveness of actions here depends on the tools used, and indicators play a significant role in this process.
These indicators are oriented to work with the options market, allow analyzing the dynamics, making the right decision about which way the asset will continue to move: up or down, which option is worth buying – a COLL or a PUT. Options allow the trader to use different tools, strategies, different types of analysis, including indicators. The advantage of binary options indicators is that they form signals which allow opening a deal at the right time and in the right direction and making a profit.
Are These Indicators Different from Indicators of Other Markets, Such as Forex, or the Stock Market?
Binary options is a new way of online trading which has a number of advantages: it is a fixed increased profitability, it is a simpler way of trading, unlike other markets: here you only need to specify the direction of the contracts: up or down. The same methods of market analysis are used for the work. They will work with both the stock market and the market forex. For example, the same indicators have moved from forex to options. Therefore, we can conclude that in such markets it is common to use the same indicators, both simple and complex.
However, it is worth remembering that the binary market has some differences from other markets. In contrast to forex, for example, here are available fixed time parameters (expiration), you only need to predict the direction of the price chart. On Forex the trader is forced to monitor how many points the price moves in the indicated direction which directly affects the profit margin which in binary trading is, on the contrary, fixed. In addition, positions can be held indefinitely, which can also lead to losses as well as to profits. In options trading, the trader knows what profit is waiting for him from trading an option, he receives it as soon as the price has started to move in the specified direction for at least one point.
In addition, a trader will have to do a lot more adjustments in order to make a deal in Forex and it is also important to understand these concepts, to be able to use the available instruments: these are different orders, leverage, spreads, swaps. There are some rare indicators on the market which are oriented to work with options, but they can be used for various purposes and for investing in Forex: for example, the BOSS indicator, The New Signal Alert, PZ Binary Options, etc. In a sense, binary options absorbed the advantages and technological features of forex, but at the same time are ready to offer a more comfortable and easy way to work with the least risk. Therefore, the specifics of trading and the use of different instruments are generally the same. For example, the same strategies of scalping, Price Action, long-term investments, systems based on the use of the same indicators, such as RSI, MACD, Stochastic, etc. are used here.
It should be noted that the options market is still relatively new, and although it uses the same strategies to Forex, forex has a longer history and therefore has more developed strategies available (for example, scalping and trend trading). Many highly accurate systems have been developed for a long time and were able to prove their profitability, they can be adapted for options trading – and this is also their advantage. For example, breakout strategies (breaking through key levels, channel boundaries, pivot points), pattern based, scalping, trend strategies, etc. – are easily adaptable for these markets.
Both these markets, forex and binary options, have a lot in common and the trader, when starting to work on them, must determine the movement of quotations. Unlike the options market, forex requires more adjustments in order to place a position. So, to limit the losses, the orders, stop-losses, take-profits are used. Let’s find the demonstration of this in the examples below.
How Is a Deal Formed on the Binary Options Market?
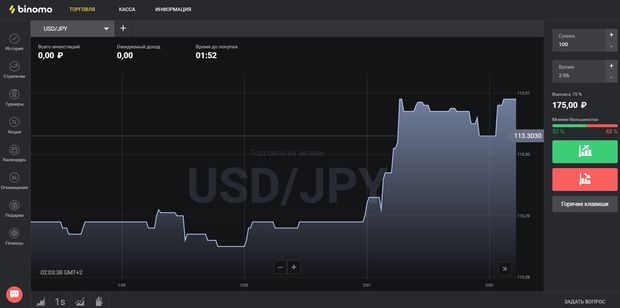
Everything is simple, which is why binary options have become so popular. In order to open a trade, it is necessary to log in to the broker’s terminal, for example, Binomo (bonus of 100% on the deposit with the promo code REVIEWEEK100 – Activate), and perform the following steps:
- Select an asset in the top toolbar.
- Select the expiration time in the block on the right.
- Indicate the amount as an investment in the asset.
- Specify a prediction of the direction of the quote’s movement by clicking one of the hotkeys on the right: up or down.
Here, even before the start of trading, the trader can see the size of the estimated fixed profit, which the broker will pay him if his forecast is confirmed:
How Is a Deal Formed on the Forex Market?
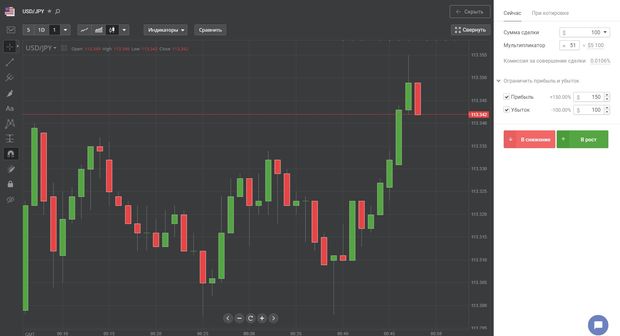
Here, in contrast to binary options, in order to open a trade, you have to make more steps in the system. To do this, you have to log in to the broker’s terminal, for example, Forex Club, and perform the following steps:
- Select an asset type in the top toolbar.
- Specify the amount of investment in the asset.
- Next, in the panel on the right side of the terminal, specify the size of the multiplier.
- Specify the parameters that limit gains and losses:
- Stop Loss,
- Take Profit,
- Specify a prediction of the direction of the dynamics of the quote: up or down by clicking one of the colored buttons on the right.
Here at the formation of the order the player sees the amount of commission, which is paid to the broker for the commission of the contract. Also here, in contrast to the options, the profit that awaits the player from the trades is not specified, this parameter is unknown to him until the completion of the deal:
Platforms with Indicators for Binary Options
Today the options market has many brokers that offer clients bonuses, and contests, including trading in various terminals. Terminal is a special software that allows the trader to log in at any time, work in a private office with the deposit, settings, as well as analyze the market and trade. All terminals differ in their possibilities, set of useful options, and types of expirations, it is also possible to study the assets available at the broker for trading.
When starting cooperation with a particular brokerage organization, the trader hopes to get from it a functional trading in a comfortable platform, which will be simple and understandable for him. For this purpose, it is recommended to register a free demo account. The brokers are trying to offer only the best solutions for the client, and their terminals can be both author’s and third-party developments. We will tell you more about that below.
Author’s Terminals with Indicators
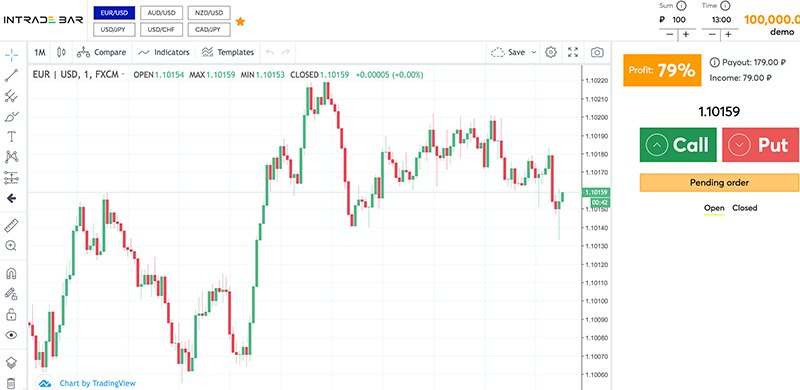
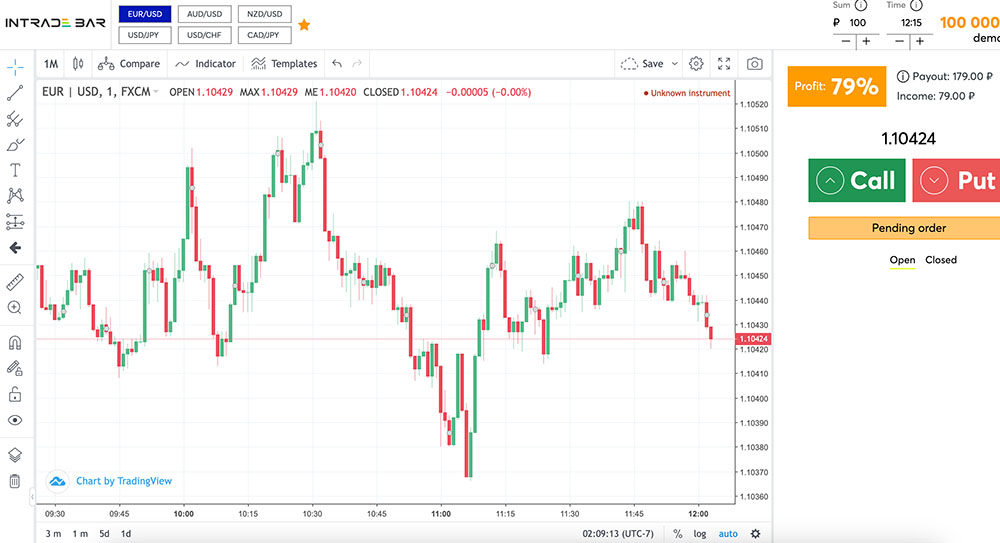
The author’s terminal is offered by brokers such as a popular broker Pocket Option, Binomo, Olimp Trade, Binary, INTRADE.BAR etc. The presence of an authoring platform indicates a company’s serious approach to the market, the fact that it is ready to invest a lot of capital in the development and design of a unique trading system. The advantage of authoring terminals is that the company is trying to simplify the work for clients, to implement only the functionality that is necessary for a user depending on the type of account, etc., including offering unique features, like types of expirations, convenient trading history, information windows, and a set of indicators.
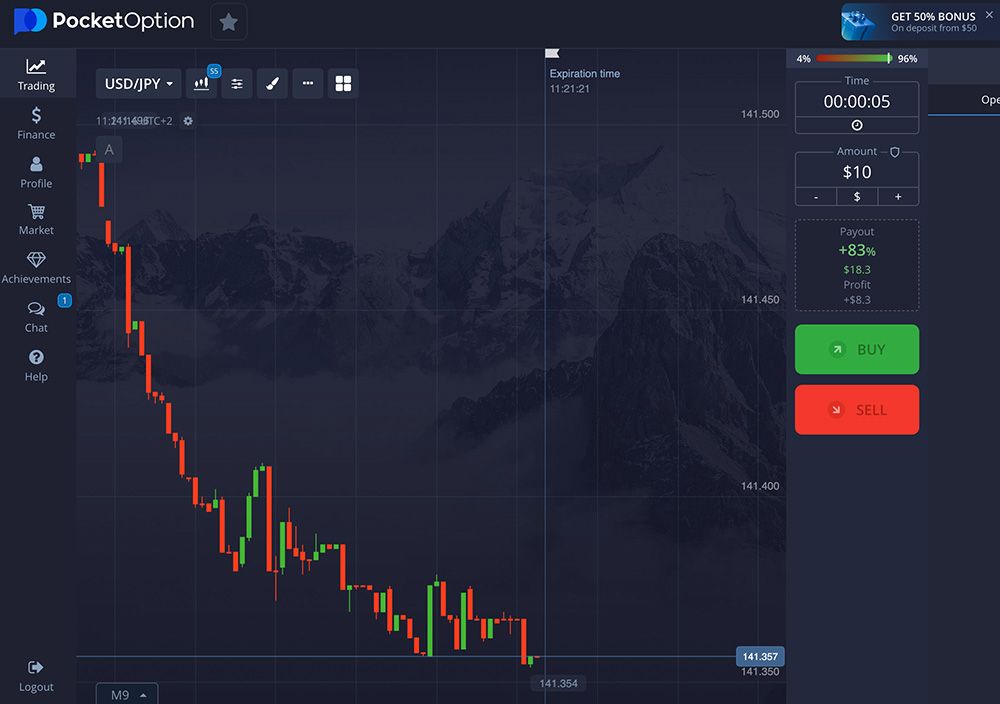
Pocket Option offers its clients one of the most advanced and innovative trading platforms for options, standing out among competitors (go on pocketoption.com). This intuitive and user-friendly program is perfectly suited for both experienced traders and beginners. The sleek, minimalist interface with a dark theme allows users to focus on trading without unnecessary distractions.
The platform provides a wide range of features, including chart type customization, the selection of expiration times and assets with real-time tracking, as well as tools for working with chart elements and indicators. Pocket Option supports over 40 indicators, such as Alligator, Moving Average, Stochastic, CCI, RSI, MACD, Bollinger Bands, ATR, ADX, Parabolic SAR, Ichimoku, Fractals, Momentum, Williams %R, Awesome Oscillator, Envelopes, ZigZag, DMI, Heiken Ashi, and many others. This allows traders to add an unlimited number of tools to the chart and customize them to suit different trading strategies. Each indicator can be fully configured to meet individual preferences, making trading as flexible and efficient as possible.
- Binomo
One of the perfect and even unique platforms on the market is offered to clients of this broker. This is a progressive program for trading options, which has no analogs in the industry. It is convenient, pleasant to work in, and easy to trade even for a beginner, who will quickly get the hang of it. The comfortable black background of the program, the convenient arrangement of options and elements, and the absence of unnecessary details – all confirm the title of one of the best platforms on the market. It offers a large selection of useful functionality: changing the chart type, selecting expirations, and assets and tracking information on them, working with graphical elements and indicators. There are 14 indicators available in the Binomo platform: Alligator, Moving Average, Stochastic, CCI, ATR, Bollinger Waves, Fractals, RSI, Wonderful Oscillator, Momentum, Parabolic SAR, Ishimoku, ADX, MACD. You can add any number of instruments to the chart, you can also implement here the work with different strategies, which will also be convenient for traders. When adding indicators to the chart, you can perform their settings.
This binary options broker also offers customers to work in a proprietary platform with many trading options. Made in pleasant light colors, this platform will make it easy to set up for productive work. There is nothing superfluous here, only necessary options: choice of asset, expiry, chart type, information of trader’s mood indicator, graphical elements, a large set of technical indicators which are conveniently divided into types: trend (SMA, WMA, Parabolic, ZigZag, Alligator, Ishimoku, etc.), oscillators (MACD, RSI, CCI, Aroon, DPO, DeMarker. The platform also offers Fibonacci Fan, Fibonacci Levels, and the trend line as graphical elements. It is worth noting that this platform offers the largest set of indicators among the companies’ own developments – this is also an undeniable advantage of the brokerage organization.
Binarium also provides its clients with an author’s platform, which is notable for its convenience and great functionality. It is easy to get started with the terminal: you can study assets, expirations, types of charts, and place up to 4 instruments in the window. There are also graphic elements and 13 indicators (e.g. Bollinger Bands, SMA, Stochastic, Alligator, RSI, MACD, etc.).
Standard terminals with indicators
Often brokerage companies offer their clients to work in terminals developed by third parties. Such terminals are found in both young and experienced companies. Should you think that offering a standard terminal is a bad sign for a broker? It isn’t, for this reason, it is important to study all the components of the company’s activity (license, experience, clients’ reviews, etc.). Standard terminals are also popular on the market, traders around the world prefer to work with them because their possibilities for trading are endless: for example, MetaTrader 4 and its updated version of the new generation. In addition to this platform, the most common are TradeSmarter, Tradologic, and TradingView. Let’s take a closer look at them in this part of the article.
- MetaTrader 4
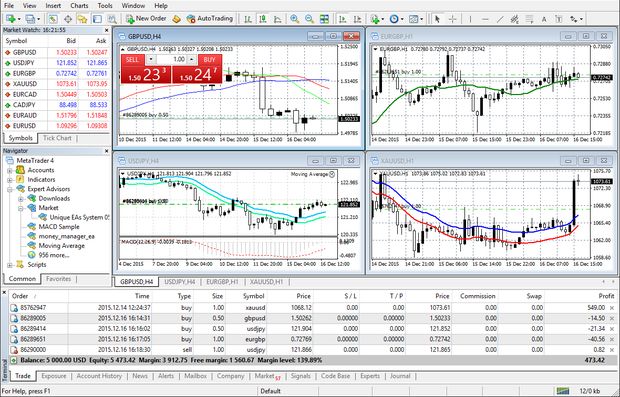
This platform, authored by MetaQuotes Software Corp. brand, the leading developer of products for the markets, it is very popular in the trading community. One can hardly find a trader who has never heard of it, and all because it offers the user, regardless of his experience, a full-fledged space to work in seconds. It is not for nothing that this powerful product is offered by so many market brokers: Alpari, RoboForex, Tickmill, NPBFX, World Forex, Grand Capital, InstaForex, Larson Holz, etc.
MT4 is a legendary platform that allows you to comfortably trade in the market, quickly place and adjust deals, change the time of expiration, change the type of chart, work with multiple charts, and personal account settings, and track trading history. It is also easy to conduct a full-fledged analysis using a large number of tools: graphic elements, and a lot of indicators (more than 30). Any number of authoring and rare indicators and entire trading systems can be loaded into the program, which does not limit the player in using trading strategies. Traders can use handy MetaEditor to write indicators, scripts, strategy tester, conduct auto-trading, trade in a mobile application, etc. MT4 is a legendary platform, universally popular with options investors, it is rightfully considered one of the most technological and functional solutions for full-fledged trading.
Usually, brokers offer to download the terminal software to the desktop of the computer for further work; in addition, its web version is also available.
- MetaTrader 5
This multi-market product is an updated program of the previous version and is considered a perfect product from MetaQuotes Software Corp. The terminal retains all the advantages of the previous platform and offers even more unique features to the players. In addition to binary options, it offers to trade forex, securities, and futures from one account. Even more options for advanced analysis are available. This is a large selection of indicators, conveniently divided into groups:
- Trends: Ishimoku, Adaptive Moving Average, Envelopes, Bollinger Bands, Fractal Adaptive Moving Average, etc.
- Oscillators: Momentum, DeMarker, MACD, Chaikin Oscillator, Stochastic, ATR, Force Index, etc.
- Bill Williams’ indicators: Alligator, MFI, Fractals, Awesome Oscillator, Gator, Accelerator Oscillator.
- Volume indicators: MFI, A/D, Volumes, On Balance Volume.
More than 40 graphical shapes are also offered: Gann, Fibonacci, Elliott tools, geometric shapes, channels, and many more.
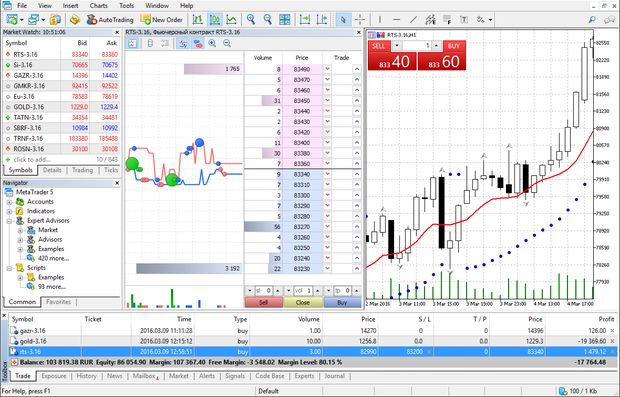
More than 80 built-in indicators and other analytical objects are available here, you can download, buy, and install indicators in the library, and you can also create your own scripts using the MQL5 language. This platform is available at brokers such as Alpari, Alfa-Forex, AMarkets, RoboForex, Tickmill, LiteForex, Corsa Capital, etc.
- TradingView
This terminal is known on the market because it offers a lot of possibilities for analyzing the dynamics of assets. TradingView, or “live chart”, is a mandatory tool for the progressive player, for whom the comfort of the service and the possibility to realize any idea in it are of great importance. TradingView is a powerful program, especially where the capabilities of the broker’s terminal end. The platform has a large number of built-in indicators, including proprietary and rare ones, so you can implement any strategy here, in addition, there are some profitable techniques on the market, which are focused on working in the “live chart”.
The terminal is made in light and dark colors – the trader can choose the most convenient design for himself. It offers a large selection of assets from different financial markets, including futures, stocks, cryptocurrencies, CFDs, and many options for market analysis: graphic elements, elements for drawing, writing text, more than 1000 indicators – both paid and free, which are divided into sections: “Built-in”, “Public”, “My Scripts”, “Volume Profile”, the App Store is also available here. Brokers of binary options couldn’t help noticing the advantages of the platform, that’s why it’s not uncommon for them to offer their clients to work in TradingView (it’s for example Binary, INTRADE.BAR, Migesco).
How Are the Indicators Used in the Broker’s Terminal?
- Pocket Option
Here, you can also work with various indicators easily and efficiently. To add an indicator to the Pocket Option terminal, first, open the trading platform. On the chart, locate the indicator icon, which is typically found on the top toolbar and resembles a graph with lines. By clicking on this icon, you will access a list of available indicators:
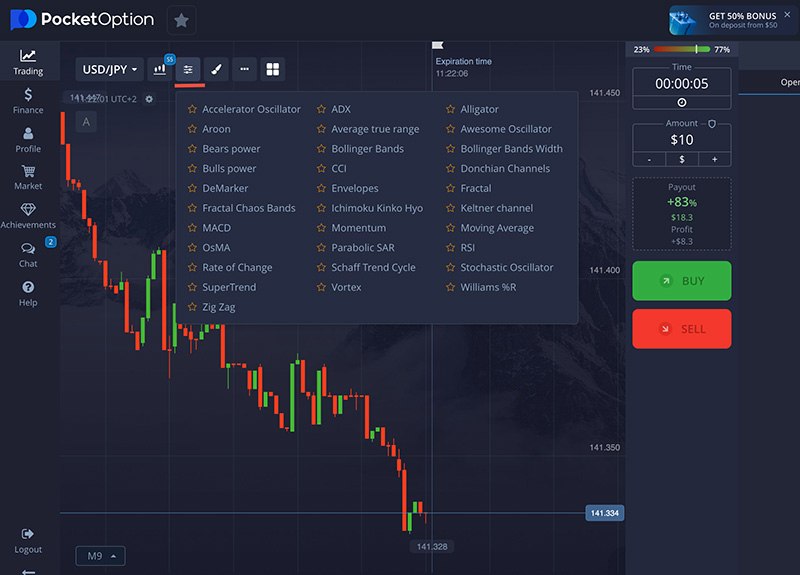
From this list, simply select the desired indicator, such as RSI, moving averages, or Bollinger Bands. Afterward, you will need to configure the indicator’s settings, such as the period, levels, and other options, which will appear in a separate window:
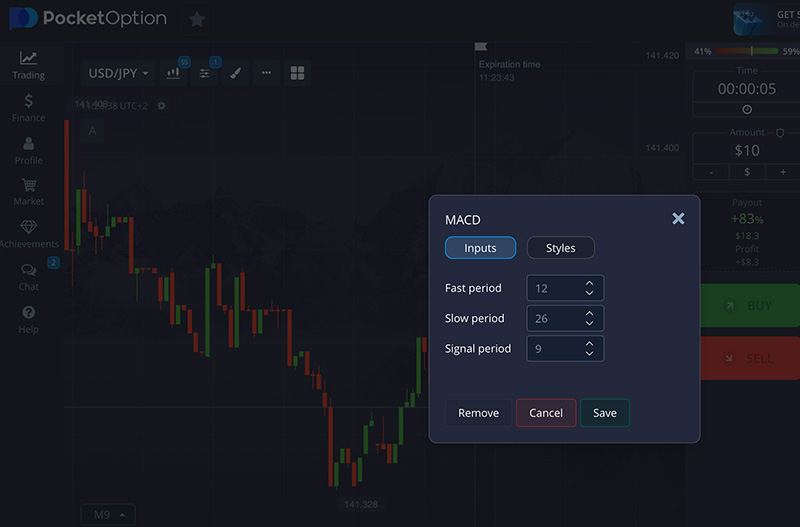
Once the settings are adjusted, confirm the addition and the indicator will immediately be displayed on the chart with real-time data:
- INTRADE.BAR
In the Intrade Bar terminal, you can also easily work with various indicators, enabling technical analysis and informed decision-making for trades.
To add an indicator to the Intrade Bar terminal, first, open the trading platform. On the chart, locate the “Indicators” icon, usually positioned on the top toolbar and resembling a graph with lines. Clicking on this icon will bring up a list of all available indicators.
From this list, select the desired indicator, such as RSI, Moving Averages, or Bollinger Bands. You will then be able to configure the indicator’s settings, including period, levels, and other parameters, which will appear in a separate window. Once all settings are finalized, confirm the addition of the indicator, and it will appear on the chart, displaying real-time data.
Thus, the Intrade Bar terminal allows for flexible customization and usage of indicators to analyze market conditions and make more precise decisions on entering or exiting trades.
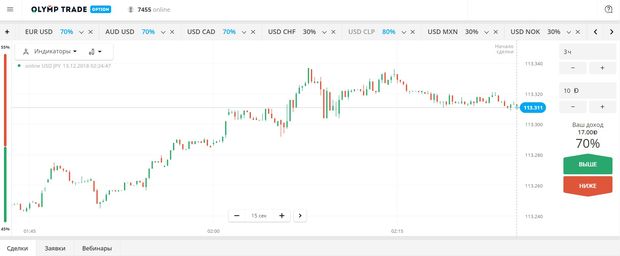
- Olimp Trade
In this terminal, you can also work with indicators, and the platform offers the largest set of tools among the brokers’ developments. The button with the choice of indicators is conveniently located directly in the trading chart field, so it’s easy to find this tool:
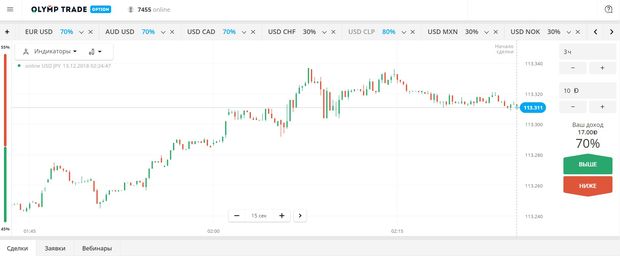
By pressing the “Indicators” button on the Olymp Trade’s website. The trader can study the large list of instruments offered here. As we have already written, all of them are divided into categories for a quick search of the necessary indicator:
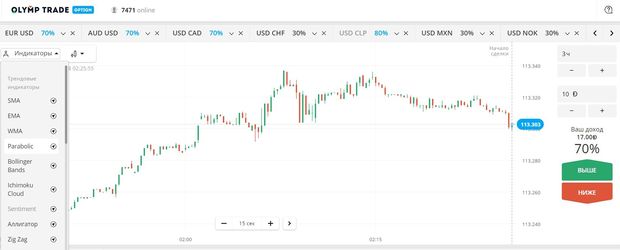
When adding an indicator, you can customize it to the necessary parameters for the strategy and change the color of its lines to work comfortably with it:
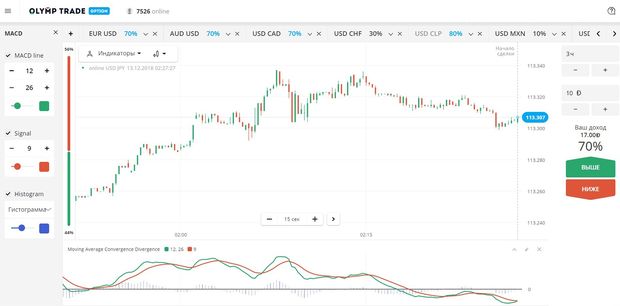
After working with its parameters, you can minimize the settings panel and start working in the market. The chart looks like this:
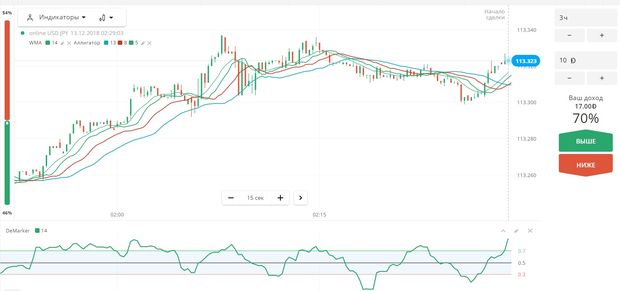
There is nothing superfluous here, all the tools look laconic. Alligator and DeMarker are added to the graphics here.
- TradingView
This terminal offers a large set of tools, which you can explore by going to the “Indicators” tab:
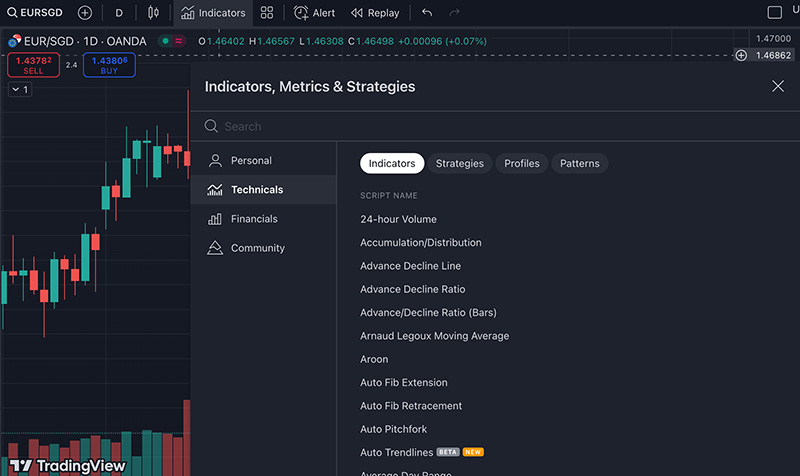
By selecting the desired one, you can configure it. The settings can be changed at any time (this option is located on the chart immediately with the name of the instrument), you can delete it and add other instruments here. After adding the necessary indicators to the chart, the player can start working. Now the main space looks as follows:
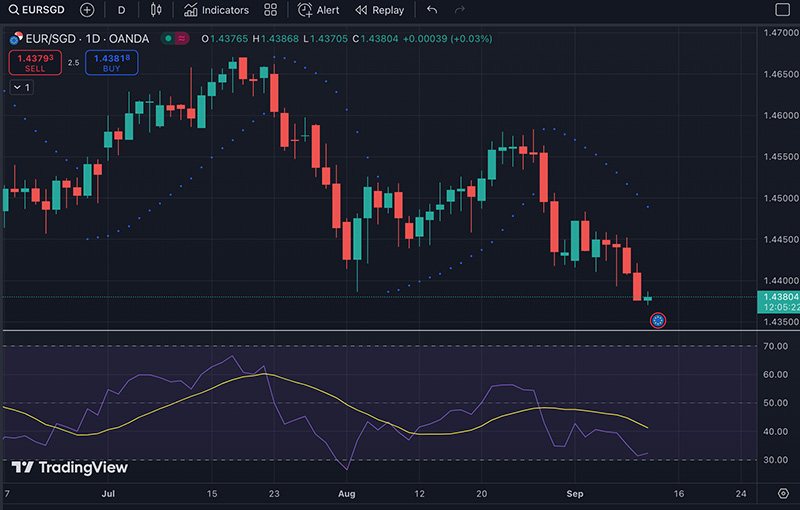
The Bollinger Lines and the Power Balance Indicator are placed in separate fields. Here it is convenient to track the dynamics of the asset, to follow the behavior of these instruments.
- Binarium
In the terminal of this broker trader is available 13 indicators (Binarium site). To explore their list, you only need to click on the special button at the very bottom of the platform:
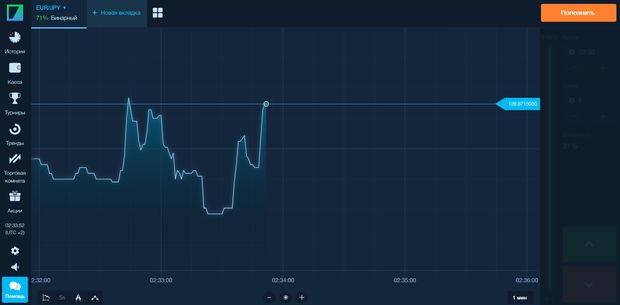
After selecting a tool by clicking on its name, you can add it to the main workspace:
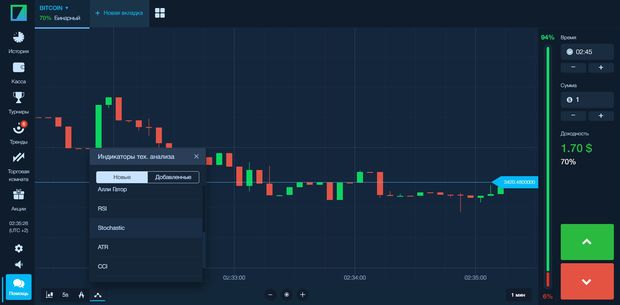
At the same time, you can set it up so that it is convenient to track its signals:
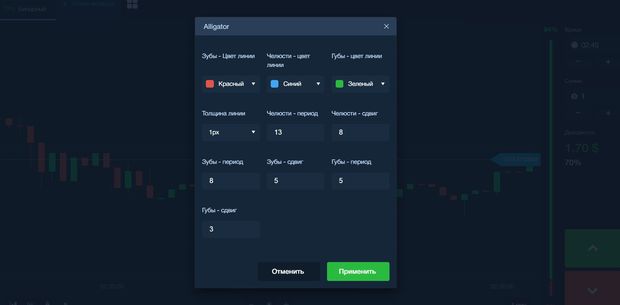
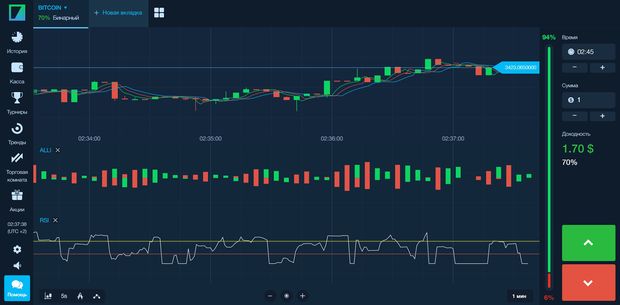
After adding the Alligator to the trading chart, the main workspace of the platform takes the following form:
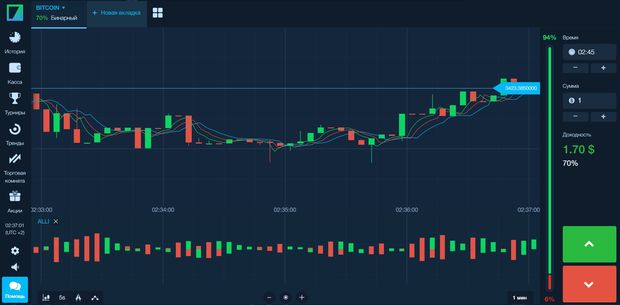
Here you can add other tools, for example, RSI, and the space of the main work will still be laconic, it is comfortable to track the picture of the market:
What to Do If the Platform Does not Have the Right Indicator?
Often traders have to deal with the fact that the broker’s terminal does not have indicators/no necessary tool to search for signals and work on the strategy. What to do in this case? There is a way out and it is used by most traders nowadays. It is the work in the terminal Metatrader 5 (or Metatrader 4). The advantage of this solution is that this unique and powerful platform not only contains many indicators that are usually unavailable to traders but also allows you to install any trader’s system indicator into its library. Of course, this is convenient for those traders who want to get the most out of working in the market. MT5 (or MT4) is the solution that will help them to achieve this goal easily, but there are some “buts” that a trader should keep in mind.
First, the quotes of this terminal may differ from the broker’s data, so both MT5 (MT4) and the broker must have the same liquidity providers. At the moment MT5 supplies the following companies’ data to the clients: Alpari, LMAX Exchange, Hotspot FX, FXCM Pro, Integral, Currenex, FastMatch, and Swissquote.
Secondly, you can add the indicator to the chart in MT5 in different ways, more about this in the next part of the article.
How to Add an Indicator to the MetaTrader 5 Chart?
- First option: Through the library of available indicators.
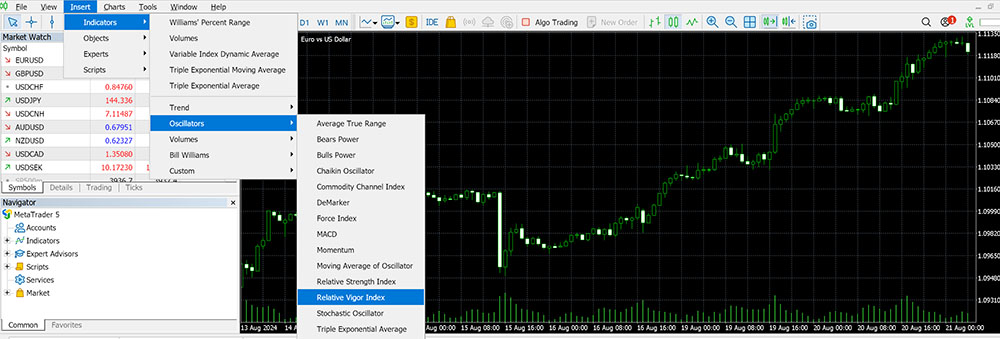
To begin with, you should check whether the necessary tool is in the library of MT5, because the program, after its installation, contains many standard tools. To check the presence of the indicator in the system, it is enough to search for it this way: Insert – Indicators – Trends (or sections Volumes, B.Williams, Oscillators or Custom):
If you click on a tool, you can immediately add it to the chart by pre-setting it. If there is no indicator in the program, you should use other ways of adding instruments to the terminal:
- Second option: Via Market.
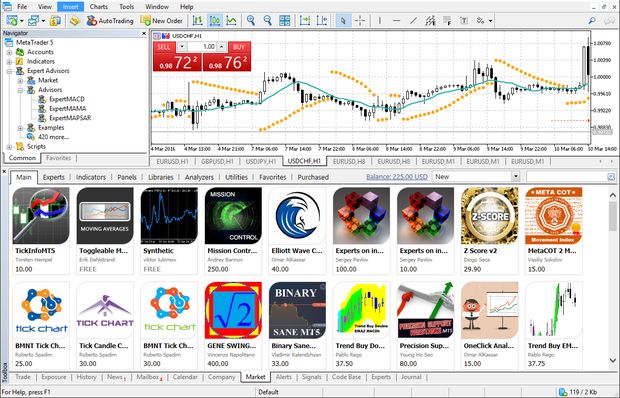
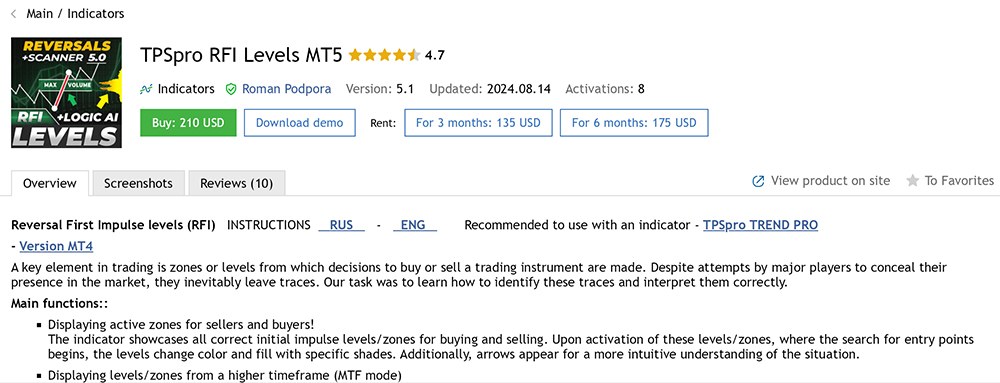
At the bottom among the various tools of the MT5 platform, there is “Market”, where you can download any indicators to your terminal (paid, free). It’s very convenient: you don’t need to search for an indicator on the Internet, which is often not fast. It’s more convenient to work in the MT5 system without worrying about the fact that the downloaded file may either contain unnecessary affiliate content, or dangerous files, which are also found on the Internet.
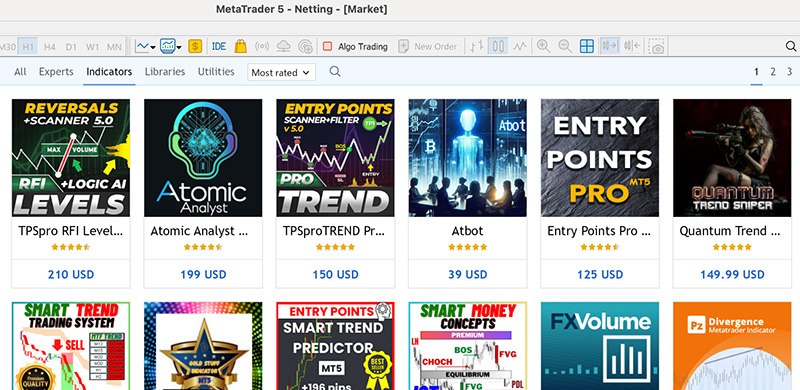
Having chosen an indicator, you can study the information about it and download it by clicking on the corresponding button:
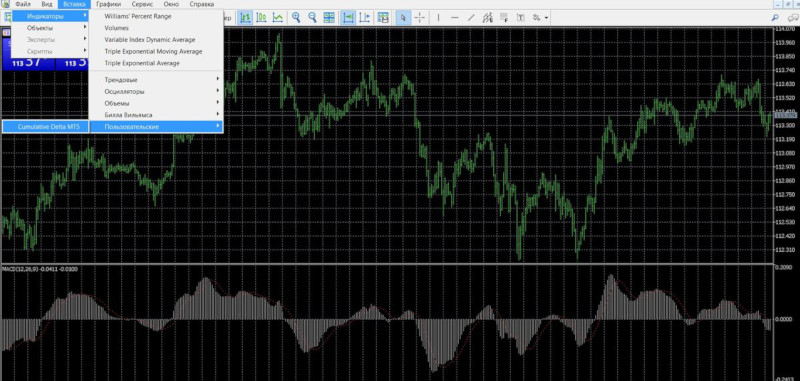
After pressing this button, the indicator is automatically added to the “Custom” folder. The system signals this with the indicators menu that appears on the left. By clicking on a specific instrument, you can add it to the chart:
Alternatively, you can close this panel and use the main menu under Insert – Indicators – Custom. Once you have selected a tool and made the necessary settings, you can add it to the chart:
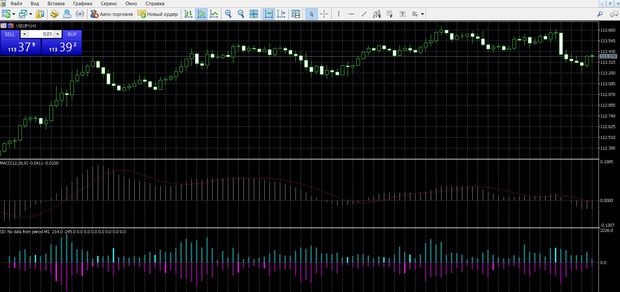
Now, you can get to work:
- Third option: Find an indicator online and install it in the indicators folder on your computer.
Sometimes it happens that even in the “Market”, both among the paid and among the free tools, there is no necessary tool, and then traders look for it online and download it in the usual way – in the catalog of instruments through your computer. How does this happen?
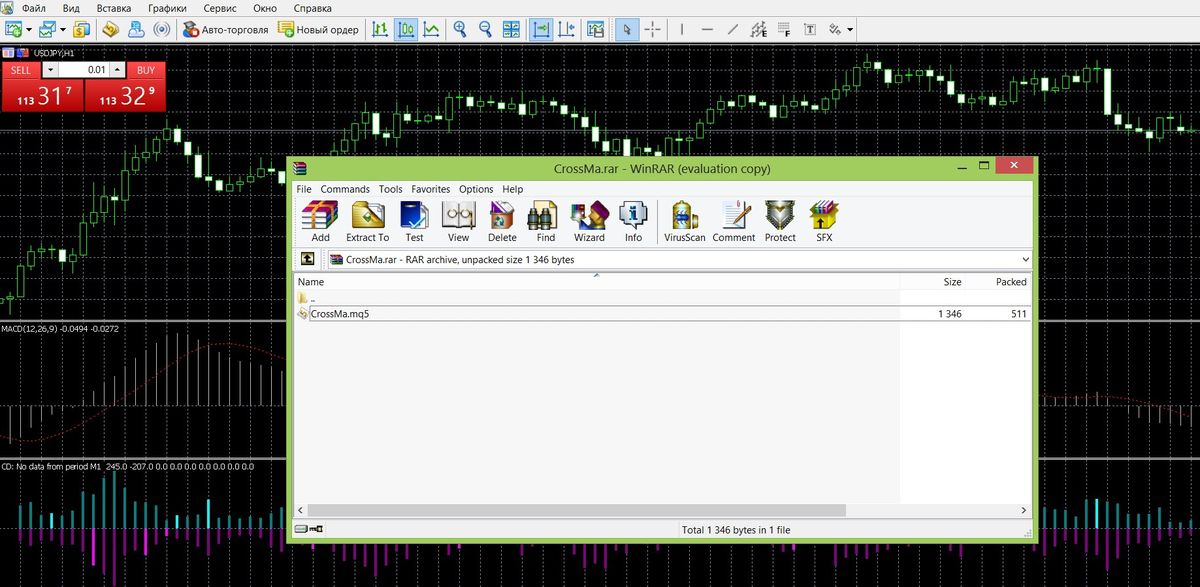
First, you need to find the indicator itself, which must have the format “mq5” (or “ex5”) for the MT5 program:
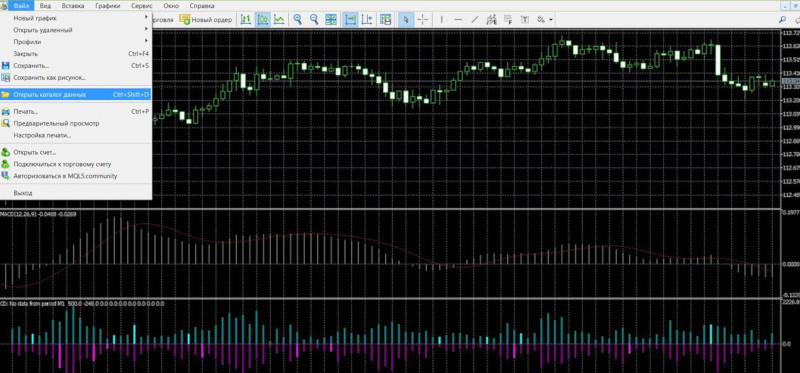
After downloading it, you need to open the data directory of the terminal:
Next, you need to do the following: open the folder MQL5 – Indicators:
Copy the tool file into the Indicators folder:
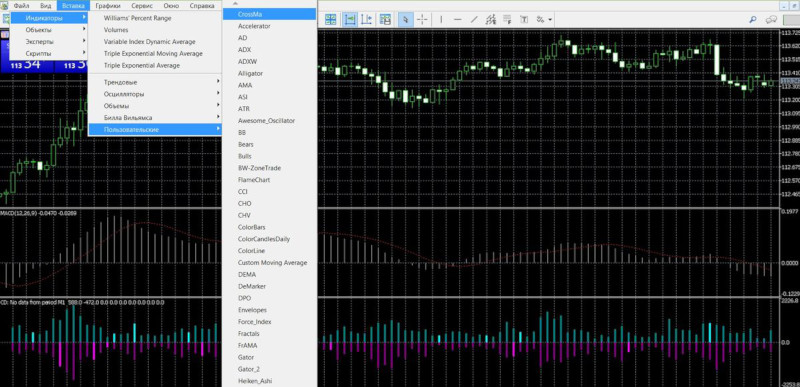
That’s it. The file is added to the user platform. Now you need to restart it, to do this close and reopen it. Then it is worth checking whether there is an indicator installed, to do this, follow the path in the top menu of the platform: Insert – Indicators – Custom:
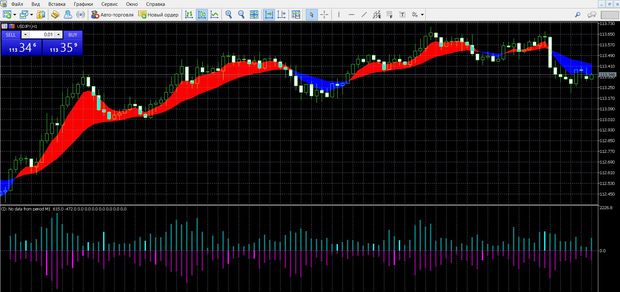
Clicking on the installed indicator, you can immediately add it to the chart, preconfiguring it or leaving its standard parameters. You can start working:
How to Get Signals for Trading Based on Indicators?
This is one of the main questions for traders who are starting to work on the market because trading signals are the thing that affect its effectiveness. Sources of signals can be both separate indicators and the whole trading system. In addition, traders often use brokers’ signals: both special services and analytics recommendations. However, the main source of signals is technical indicators. In this case, the trader usually works simultaneously in the broker’s terminal and MT5 (MT4) platform. Let us show you how to search for RSI signals in the MT5 terminal. This tool is popular among traders, especially for beginners, because it has a simple principle of operation, and generates clear signals to start profitable trading: these are signals of divergence, crossing the central line, overbought/oversold:
How to Trade Options with RSI in MT5
Overbought/oversold:
If the RSI is located at 70, it is an overbought zone (a downtrend), at which point you can buy PUT options:
If the RSI is located at 30, it is an oversold zone (or an uptrend), at which point you can buy KOLL options:
Intersections of the center line:
If the RSI crosses the 50 line and moves upward, you can place a call option:
If it crosses line 50, moving downward, you can make out PUT options:
Discrepancies:
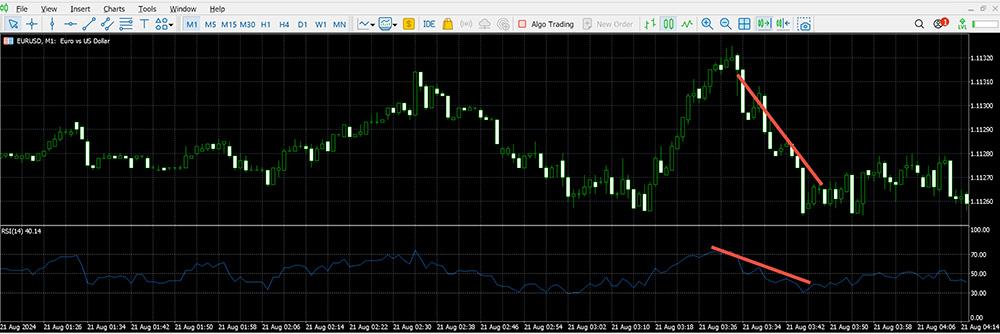
In a divergence situation, the highs of the price line are not confirmed by the RSI, you should purchase a contract with the value of the KOLL:
At the convergence minimum of the value line is not confirmed by the RSI data, it is worth buying a contract with the value of PUT.
Binary Options Indicators
Trend Indicators
- Moving Average
One of the first tools used by newcomers to the market, it shows the average value over some time. It has the form of a curve, calculated based on the dynamics of the value. On the chart it is a constantly curving line, repeating the movements of the price line, but following it more smoothly. You can say that the MA is a player’s assistant, which is usually used to confirm the trend, not for nothing it is so often used in strategies. As a signal indicator, MA is commonly used with a period of 40. In this case, the purchase of an option KOLL on the opening of a new candle occurs if the previous candle closes above the MA; registration of the option PUT occurs if the price crosses the MA downwards, and the candle in this case closes below the line.
- MACD
It is also one of the popular tools which, by exactly following the trend, can show the ratio of the two moving averages. It is most effective during strong market fluctuations, it is necessary when looking for moments of divergence, crossover with the price, or overbought/oversold. Its particular advantage is that it shows the best positions for entering the market, as it has the properties of a leading oscillator. When searching for signals when the zero line is crossed, traders are guided by the following indicators: if the indicator tends in the direction below the central level, it is possible to buy a PUT option, if, on the contrary, it rises in the direction above – it is possible to buy a COLL option.
- Bollinger Bands
This indicator can detect abnormally sharp price deviations from the trend, which is especially valuable. Because it is an oscillating tool, it is used for market volatility, it will allow you to assess whether the price is low or high compared to the trend, to predict the possible rise/decline to its level. Because it detects extreme deviations in price, you can adjust your strategy. It is best suited for identifying positions to enter trades in a clear trend. In the case of a steady bullish trend, the best position to trade will be when the price line has broken through the lower band and then returned back into the range. In the case of a sustained bearish trend, the best entry position is when the price breaks the upper band and then moves back into the range. As for the sideways trend, there is a large number of false signals, you should be careful when trading this way.
- Average Directional Index
This tool will be useful in determining the strength of the price movement. If the trader works with trends, this tool is a real godsend for him. It is simple, contains minimal settings, and is reliable, but because it is still a trending tool, its signals lag behind the current market situation, and you can’t do without lags here. This indicator consists of 2 lines (+DI – green lines, -DI – red lines), the position of which relative to each other – is the effective signal: if the green line rises above the red one, you can conclude contracts on options KOLL; if the red line rises above the green, you can conclude contracts on options PUT.
- Alligator
Also one of the popular indicators used by traders. While at first glance a complex figure is formed on the chart when it is added, it is easy and simple to work with and you can see that by understanding the features of the tool. It consists of 3 slips (with different period settings) which resemble an alligator pattern, that is why it is called that way. As traders know, the market can be flat (The alligator is asleep), it can move dynamically changing trends (The alligator is awake and hungry, it starts hunting), and knowing such phases will allow it to enter the market timely and make a profit from trading options.
Alligator is used in determining the market trends, that are most favorable to profit, its purpose is to show the player the incipient trend. The main drawback of this tool is that it, like all trend indicators, is lagging. Often trading with the Alligator is based on the signals of its lines: when its green MA crosses the red one from bottom to top, you can execute contracts of KOLL options, when its lip lines cross the teeth in the direction from top to bottom, you can execute contracts of PUT options.
Indicator Oscillators
- RSI
This is one of those tools that are most popular with traders of different experiences. Its advantage is that it is incredibly useful, but it is very simple, it does not require serious adjustments, it generates simple signals, fluctuating between 1 and 100, it shows the extremes of price. RSI evaluates price dynamics relative to its previous data, allows you to determine the mood of the players, the moments of overbought/oversold, and correction/reversal, and allows you to understand when the price, having turned around, will give the beginning of the trend. Here you can trade by tracing overbought/oversold values, for example: If the RSI crosses 70 from above downwards, you can place an order to buy DOWN options, if it crosses 30 from below upwards, you can place an order to buy UP options.
- Stochastic
Also one of the main tools of traders, reminiscent of RSI, but it differs in simple operation, a minimum of settings and at the same time high efficiency of signals. This is one of the oldest tools, which is actively used in determining the current percentage of the price, as well as growth and decline in price, when looking for convenient positions to enter the transaction. It consists of lines %K (fast) and %D (slow), whose data are in the range from 0 to 100. Thus, a corridor is formed, and its data about the overbought or oversold condition of the asset can be applied in your work. Most often Stochastic is used so that traders buy contracts when one of its lines falls below 20 and then rises above it again; they sell contracts when its lines first rise above 80 and then fall below that level again.
This oscillator, which tracks data on the rate of price movement, is also actively used by traders to get information about overbought/oversold, to see the reversal points. It looks a lot like Stochastic, it is easy to work, but it is very effective, most often it is used according to the following strategy: we buy an Up option when the instrument is oversold (i.e. the instrument indicators are in the -80% and below); we sell an Option Down when the asset is overbought (i.e. the instrument indicators are in the -20% and above).
- Average True Range
This oscillator shows information about the current market volatility, and determines the range of price fluctuations (both maximum and minimum). Its difference and value lie in the fact that without answering the question “where the price line will go”, it shows the market volatility, which indicates the emergence of a new trend after the flat. Due to this fact, it has become popular with traders, who actively use its data in various strategies. By visually showing market phases or activity levels, it shows the flat, as well as bullish or bearish trends, allowing a trader to get information about when it is worth refraining from trading and when it is worth entering a position. At the same time, the stronger the trend, the more reliable the point to enter, which allows you to minimize losses. This tool is simple, it is interpreted the same way as other volatility indicators: the higher its indicators, the higher the probability of trend change, the lower they are, the weaker the trend.
Volume Indicators
- On Balance Volume
This is a trend tool, which is one of the simple and effective similar tools. Its data is calculated on information about trading volumes. The tool was introduced in the technical analysis among the first ones to study the money flows, it confirms the trends and trading volumes. Since it generates anticipatory data, it is actively used by traders. It is accepted that if the closing price is higher than the previous one, the volume of the candle is added to the OBV; if it is lower than the previous one, the data is subtracted from the OBV; if the value data coincides with the previous one, the OBV remains in the same position. If the volume increases or decreases without changing the value, it confirms the soon strong dynamics. If both the instrument and the price are rising, the market is in an upward trend and vice versa. OBV allows you to work with support/resistance levels, and divergences, and confirm trends and reversals. If the information is confirmed by the price, you can buy or sell assets.
- Market Facilitation Index
This indicator sounds in translation as the Market Facilitation Index, it is considered one of the most effective tools for assessing the state of the trend and market reaction to shifts in trading volumes. It is similar to RSI in structure, convenient, simple, and clear, so it can be used both by beginners and professional traders.
As soon as buyers or sellers’ interest in an asset decreases or increases, it is reflected in the productivity of the market, affecting the indicators of trading volumes. By adding the MFI to the chart, you can work with information about the strength of cash flows, and the intensity of investments in assets. By comparing positive/negative cash flow data, a trader can obtain information about the strength of the trend. Like the RSI, it is used to determine overbought/oversold and divergences. Working with overbought/oversold signals, it is customary to act as follows: sell PUT options if the MFI is above the 80 mark and cross it downwards and buy KOLL contracts if the instrument is below 20 and then cross it in a downward direction.
- Accumulation/Distribution (A/D)
The Accumulation/Distribution indicator is an effective trending source of data on trading volumes, and allows you to get information on the state of supply and demand for assets to understand whether players are buying and selling. This tool allows you to identify divergences or current trends and has proven to be a reliable source of data. In strong downtrends/uptrends, the A/D moving in the same direction as the price confirms the trend. By tracking its behavior on the chart, you can buy and sell assets.
Channel Indicators
- Andrews’ pitchfork
This is one of the interesting tools for market analysis, which will allow us to get information about the price movement, and profitable trading both along the trend and against it. It is especially useful for those players who prefer to work with channel strategies – simple but effective ways to find trend direction signals and trade. When added, the indicator takes the form of a fork of three straight levels. It is worth opening transactions in the following cases: when the rebound from the lower border of the channel is worth buying options KOLL when the rebound from the upper border of the channel should buy options PUT. Thanks to the construction of the tool in the form of a channel on the chart you can easily track the dynamics of the asset, the nature of the trend or its correction, making the right conclusions, in time to enter into a deal.
- Keltner Channels
This is one of the popular channel indicators, quite well spread in the market today in the form of various strategies. Its analogues: Bollinger Bands, Envelopes. This tool consists of 3 lines and is used in determining price breakouts, trends, and overbought/oversold information. It tracks trends, but instead of “percentages” (like Converts) or standard deviations (Bollinger Bands), it uses data from the average true range indicator, which reduces the number of false signals. Because the tool belongs to trend indicators, it signals the state of the market, forming all data within the channel: if it is directed upwards, it indicates an uptrend, if downwards – it is a downtrend. However, like other trend tools, its data still lags.
Level indicators
- Zone
This classic level indicator is actively used to accurately find areas of support and resistance. Levels here are the elements that allow you to get the most information about the market and enter a profitable trade. In addition, it is a simple indicator both in its construction and in its data handling. Zone is ideal for beginners, for those who are interested in information about the supply and demand of an asset. Trading is done either by breakouts or by bounces from levels: if the price bounces from a support level, you have to buy the asset, if it bounces from a resistance level, you have to sell it; if the price breaks through a support level, it is time to sell the asset and if it breaks through a resistance level, it is time to buy it.
- SS Support Resistance
Like other level indicators, this tool has an identical structure and working principle and allows you to profit when working with support and resistance levels. In addition, you can set alerts and get accurate system signals in time. In just a couple of clicks you can add levels to the asset chart and start working, using either the same strategy for bounces or breakouts.
- AutoFib Trade Zones
Also, a tool actively used in the market by those players who prefer to trade using signals generated by level systems. Here it is proposed to determine the levels of opening transactions using the Fibonacci grid. AutoFib Trade Zones are used to identify pullback zones and timely entry into a position, which is what the Fibonacci grid is for. At that, zones for entering the market are conveniently marked in color. As with other level indicators, it is customary for traders to use rebound and breakout trading strategies here.
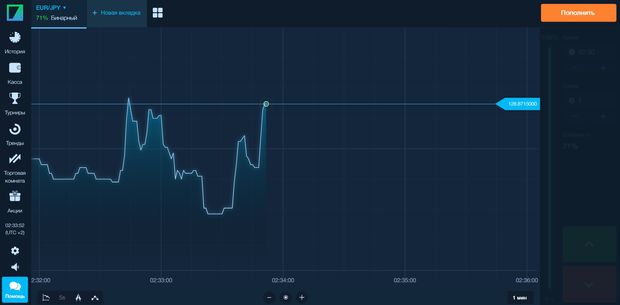
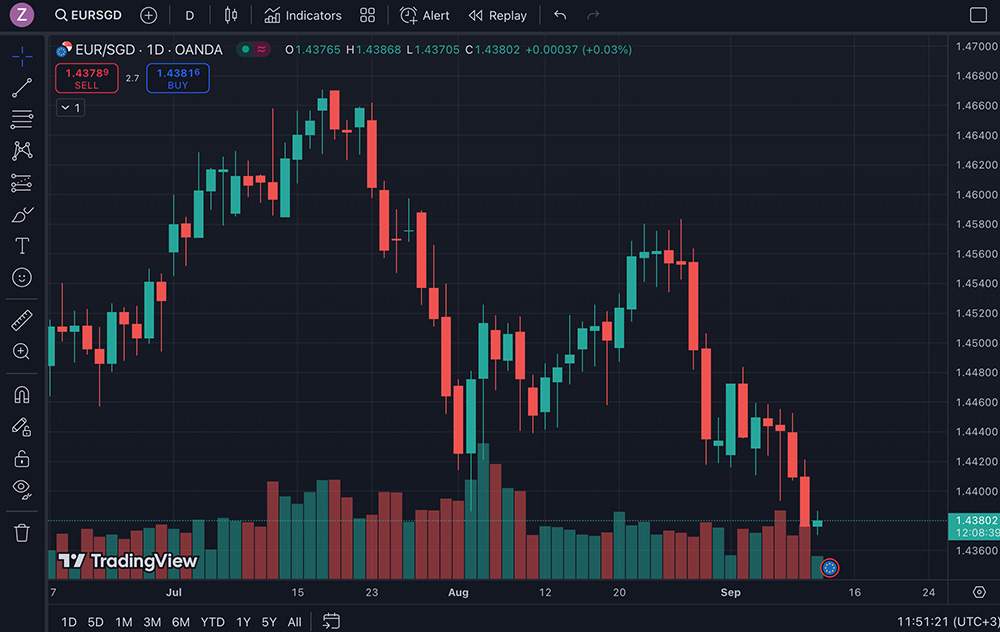
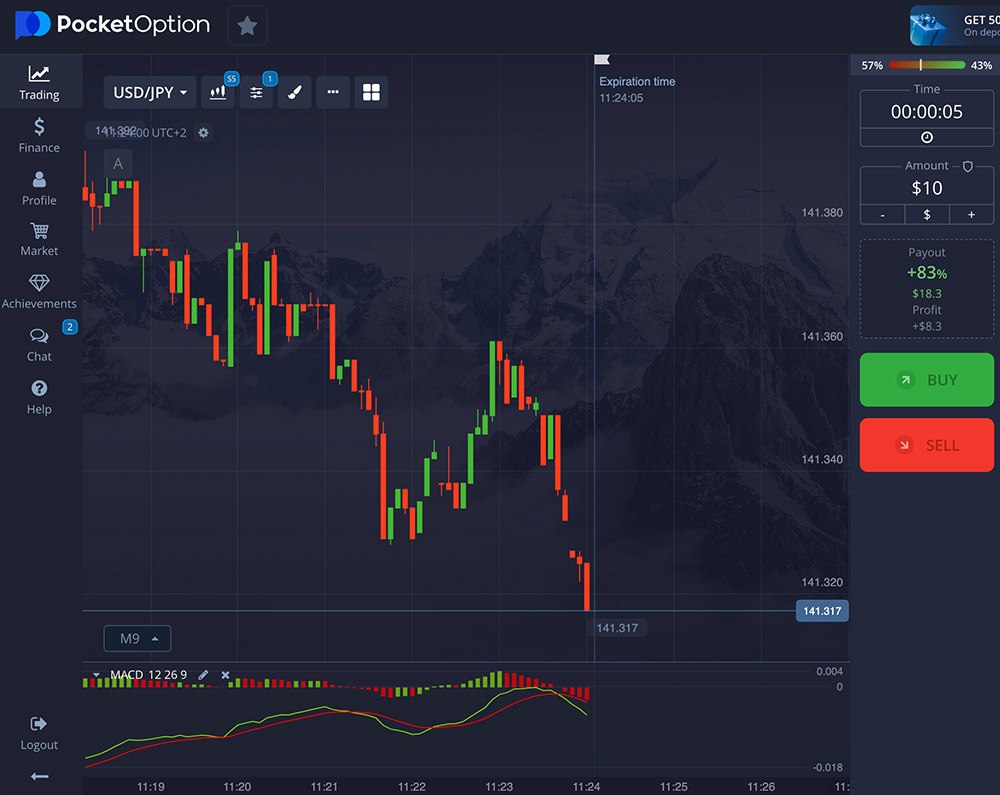
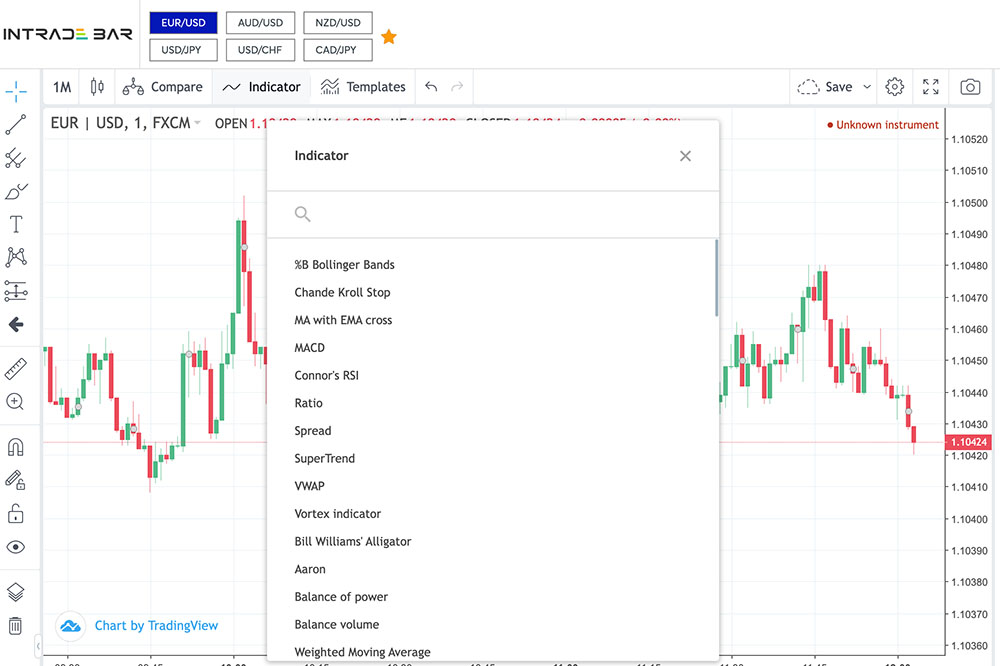






The indicators from the binomo platform help me a lot in trading, thanks to them I can competently analyze the charts and make a profit.