AMA Indicator (Adaptive Moving Average)
Contents
Description of the AMA indicator
The moving average is a classic indicator for binary options trading. As a rule, the three most common types of slides are integrated into trading platforms – SMA, EMA and WMA.
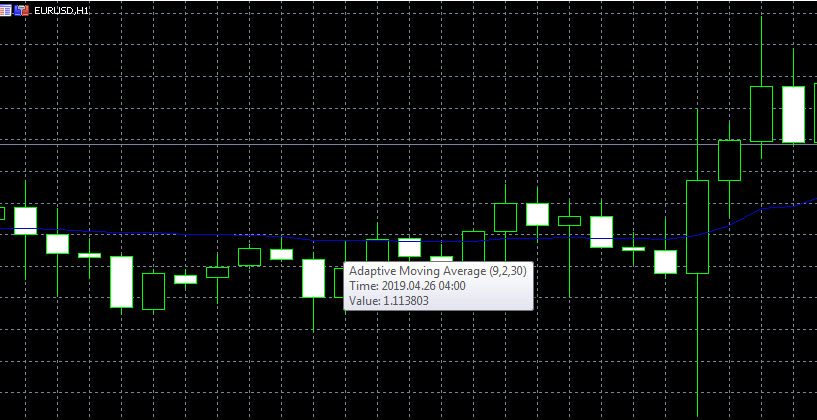
Image. 1
They differ in the principle of price averaging over a certain period of time. Moving averages are popular and there are a lot of binary options strategiesBut they have some disadvantages. One of the main disadvantages – on short timeframes indicators give a lot of false signals, and on long timeframes their signals lag behind, give data on the entry to trade after the trend has already turned around and the prices are no longer the most favorable.
The AMA indicator (Adaptive Moving Average, fig. 1) was developed by Perry Kaufman, a prominent practitioner and theorist of trading, in 1995 during his search for a trend indicator for binary optionsThe indicator created by Kaufman is an advanced version of the moving average. We can say that the indicator created by Kaufman is an advanced version of the moving average.
| Broker | Bonuses | Open an account |
|---|---|---|
|
1
|
50 %
Bonus on deposit from $100 USD – promo code WELCOME50
|
Start |
|
2
|
From 25 To 60 %
Deposit increase for the first deposit
|
Start |
|
3
|
Cashback
Refunds of commissions, spreads and other costs
|
Start |
|
4
|
100 USD
Loyalty program remuneration
|
Start |
|
5
|
20 %
Bonus and cashback by promo code revieweek23
|
Start |
For the indicator to adapt to the market volatility, SSC (Scaled Smoothing Constant) and ER (Effectively Ratio – ratio of trend direction to market volatility) variable have been introduced into its calculation algorithm. With a strong price movement ER tends to one, with a weak movement – to zero. In general, the formula that forms the basis of the AMA indicator is quite complex and consists of several equations.
Kaufman managed to create an indicator, which greatly reduces the disadvantages of moving averages, although it does not get rid of them at all. Besides, the AMA is the only moving average indicator, which takes volatility into account. During the flat price movement the dynamics of AMA indicator on the chart is smoother, which helps avoid false signals. During periods of a pronounced trend, the AMA is more sensitive, which allows the trader to react faster to trend changes and make more accurate bets.
Because of this feature, many traders believe that it is optimal to trade with an adaptive moving average during sufficiently long price movements, and during short-term changes a simple moving average can be more effective. But, compared to other types of moving averages, the AMA indicator signals are minimally delayed on reversals and trend changes. The Adaptive Moving Average indicator is considered quite complicated, its application in practice requires knowledge and experience (Binary options trading training).
AMA indicator in the MetaTrader 5 platform
AMA is popular among traders, but it is not standard for trading terminals. There are two types of Adaptive Moving Average in MT5 terminal: in the Trend Indicators section (fig. 2) and in the “Examples” section (fig. 3).
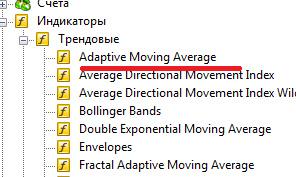
Image. 2
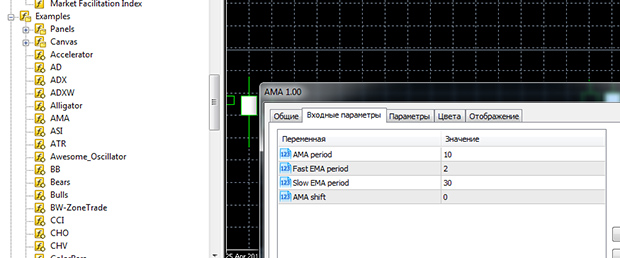
Image. 3
To install AMA in MT4 you need to download it and upload it to the list of indicators. Standard settings of the adapted moving average period, its fast and slow constants do not need to be changed, if it is supposed to trade on intervals from M15 to H1. On other intervals it is recommended to change the parameters, but after that you should take your time to test the new settings.
The AMA indicator can be supplemented with color indications (Fig. 4), for example, the red line indicates an uptrend, the blue one – a downtrend. The indicator line can be presented as points. This version of the indicator allows for a more accurate interpretation of incoming signals.
AMA indicator signals
In general, the indicator of the adaptive sliding trading signals as a simple moving average or another type of moving average crossed by the price line. When the AMA indicator line is directed upwards and price crosses its line from below to above, it is a signal to buy. When the Adaptive Moving Average is directed downward and price crosses it from top to bottom, that is a signal to sell. If the signals of AMA indicator and the price are opposite, this is a signal for a wait-and-see position for a trader. In the application of moving strategies, their breakthrough is not a signal for the immediate opening of a position. It is necessary to wait for the price to fix on a new level.
AMA indicator in a sideways movement of the price is complemented by other indicators and oscillators for binary optionssuch as Momentum, OBV, RSI. But even with a strong trend movement can be a lot of false signals and losing trades.
Kaufman, the developer of the indicator himself, believed that AMA gives quite a lot of false signals and introduced an additional filtration technique, which takes into account the values of AMA on the adjacent periods to the period analyzed by the trader. This has made the indicator formula even more complicated. But traders, of course, do not need to delve into the mathematical description of the indicator.
To increase the effectiveness of adaptive sliding, usually use additional indicators and oscillators.
Trading strategies based on the AMA indicator
There are not many strategies that focus on the use of the adaptive moving average. The main one is a simple method of predicting price dynamics by AMA signals: if the price is higher than the moving average, it can be a signal to buy. The strategy is suitable for any MA indicator, but with AMA the result can be better.
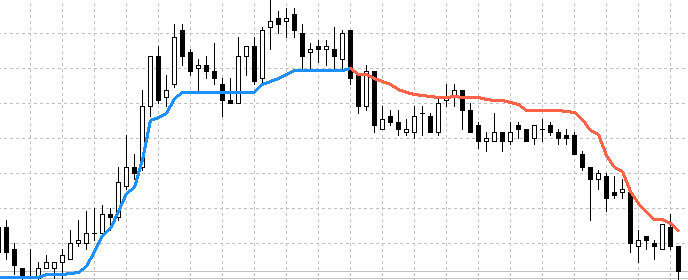
Image. 4
Strategies that use several moving averages – two or three, of different types and with different settings – are popular in the market. In particular, such a strategy should have the MA indicator with short and longer time periods. MA crossing will be signals to open trades. For example, you can use Simple Moving Average (Fig. 5) with a shorter period and AMA with a longer one.
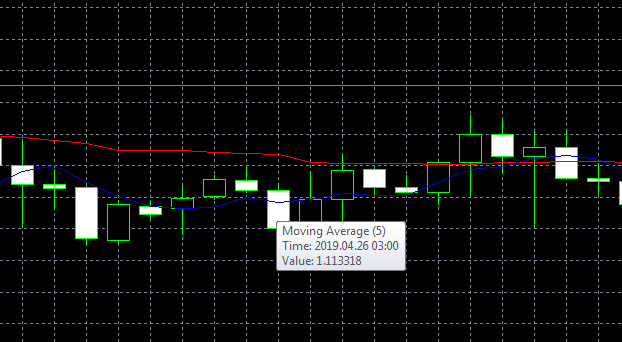
Image. 5
When implementing trading strategies using the adaptive moving average indicator, it is necessary to consider such conditions as dominant price trends, peculiarities of price dynamics – impulse or smoothed changes, the volatility of the asset during the day.
If the volatility is high, the AMA period is set from 7 to 14, depending on the timeframe. The smoothing constant SSC are based on constants – fast and slow averaging. If volatility is high, the averaging of the slow constant should be set not more than 45, the averaging of the fast one – from 4 to 7.
For forex trading It is not necessary to change the set parameters, while trading some currency pairs it is not recommended at all. Usually AMA parameters are changed in the direction of increasing the sensitivity to price changes. In any case, after changing the settings it is necessary to test the operation of the instrument.
Despite the fact that the AMA generates more accurate signals, there will still be false signals. They should be filtered using oscillators, for example, accumulation-distribution A/D, RSI Relative Strength Index, Chaikin oscillator and adaptive Stochastic. Most strategies are based on the joint use of AMA and these oscillators. The optimal timeframe for trading strategies with AMA is 1H.
Interaction with the Chaikin Oscillator (Fig. 6) is one of the popular strategies for adaptive moving average. The Chaikin’s oscillator allows to establish the dynamics of trading volumes for a certain period of time. It is most often used to predict divergences, i.e. divergences between price and indicator values. But in the strategy with the AMA, the oscillator is needed to predict overbought or oversold levels.
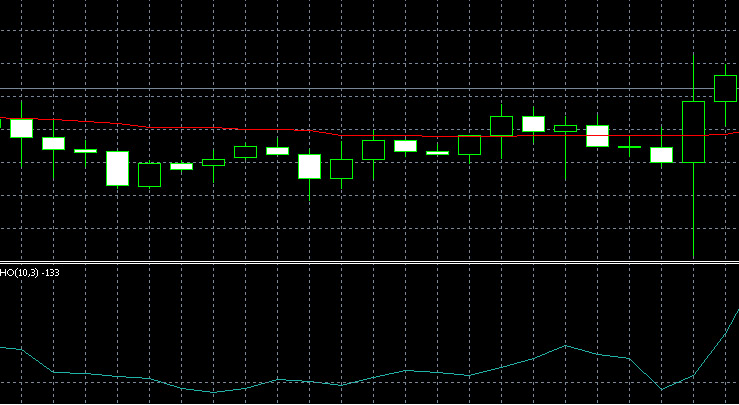
Image. 6
With the AMA in the form of colored lines (e.g. on MT4) signals to open a deal to increase the price will be the line of blue color, the price figures should be above the moving line, the Chaikin oscillator shows oversold, its curve is directed up. Price indicators are below the AMA, the line color is red, Chaikin’s oscillator curve is directed downwards and shows possible overbought – signals for opening a deal on price decrease.
The effectiveness of the strategy depends on how correctly the trader defined the necessary settings for the adaptive moving average indicator. This can take a lot of time and testing the technique in the terminal’s demo mode. But if the parameters are set correctly, the strategy is considered to be very effective. The strategy “AMA + Chaikin Oscillator” is not simple and not recommended for novice traders.
Another fairly well-known strategy is “AMA + MACD“. The popular MACD (Moving Average Convergence/Divergence, Figure 7) oscillator is used here to check the strength and direction of the trend and helps identify turning points. The MACD is based on moving averages and complements the AMA well.
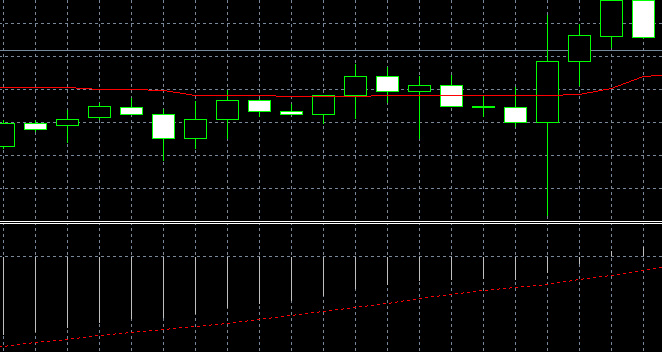
Image. 8
In the strategy, if the AMA shows an uptrend and the MACD oscillator creates a histogram above the zero mark, it can serve as a signal to buy. If the AMA shows a downtrend and the MACD oscillator shows a histogram below the zero mark, it confirms the beginning of a downtrend and can serve as a signal to sell. This strategy is more effective when colored versions of the indicators are used.
In another strategy, Adaptive Moving Average (AMA), Moving Average (MA) and Parabolic SAR (PSAR). Signal to buy will be AMA crossing from bottom to top MA, PSAR is under the chart. The signal for sale will be a crossing of AMA from above downward by MA, PSAR is above the chart.
Conclusions
The Adaptive Moving Average AMA is one of the most effective trading tools and can be an alternative to more traditional indicators. But its application requires some experience.
The application of AMA is more appropriate in periods of a pronounced trend. This tool, in comparison with other moving averages, gives signals faster and there are less false signals, but it does not mean that AMA is free from them and this should be taken into account. AMA indicator is not a standard tool for the trading terminals. On the chart it can be presented in different versions that make it more effective.
Although it is possible to use a single Adaptive Moving Average indicator for trading, it is more effective when supported by other indicators and oscillators, in which case it can become the trader’s main profitable strategy.