Demark Oscillator
Contents
Description of the Demark oscillator
The DeMarker indicator (Fig. 1) was developed by Thomas R. Demark, a prominent trading theorist and practitioner, and is described in his book “The New Science of Technical Analysis”.
Image. 1
Demark’s goal was to create an indicator of overbought and oversold demand dynamics, which would also show the degree of risk of buying and selling. In doing so, the new forex indicator should not have typical disadvantages of instruments of similar orientation. Demark indicator shows the possible change of the trend when the price approaches the extremums and is built on the principle of comparing the maximum for a certain interval with the maximum of the previous period.
The Demarker formula is quite complex and contains several steps. First, the DeMax i index of maxima is calculated, which demonstrates how much the current maximum is higher than the previous one, according to the formula: if HIGH i > HIGH i – 1, then DeMax i = HIGH i – HIGH i – 1, otherwise DeMax i = 0, where:
- HIGH i – the maximum price of the current bar;
- HIGH i – 1 – the maximum price of the previous bar.
Then the index of minima DeMin i is determined – how much the current minimum is less than the previous one, by the formula: if LOW i < LOW i – 1, then DeMin i = LOW i – 1 – LOW i, otherwise DeMin i = 0, where:
- LOW i – the minimum price of the current bar;
- LOW i – 1 – minimum price of the previous bar.
After calculating the minima and maxima, the DeMarker i indicator is determined by the formula DMark(i) = SMA(DeMax, N)/(SMA(DeMax, N) +SMA(DeMin, N)), where SMA – simple moving average, N – number of moving average periods.
Originally the standard Demarker period is 13 days, but the author described the indicator as effective for other periods as well. In the trading terminals, the standard period more often equals 14. On longer Demarker periods you can determine the long-term trend, shorter periods are used to open positions by trend.
The preset overbought and oversold limits of the oscillator are 0.7 (70%) and 0.3 (30%), but they can also be adjusted for a specific strategy, though it is not recommended for beginners (Fig. 2):
Image. 2
Demark oscillator in the MetaTrader 5 platform
The Demarker oscillator is not present in the trading terminals of all trading systems, but, for example, it is in MT5 among the preinstalled tools. It can be downloaded from the navigation panel on the left and its period and level parameters can be changed.
Log in to your broker’s terminal, add the Demark oscillator to the chart and see what comes out
| Broker | Bonuses | Open an account |
|---|---|---|
|
1
|
50 %
Bonus on deposit from $100 USD – promo code WELCOME50
|
Start |
|
2
|
From 25 To 60 %
Deposit increase for the first deposit
|
Start |
|
3
|
Cashback
Refunds of commissions, spreads and other costs
|
Start |
|
4
|
100 USD
Loyalty program remuneration
|
Start |
|
5
|
20 %
Bonus and cashback by promo code revieweek23
|
Start |
Demarker oscillator signals
Demarker generates the following basic Forex Signals The following are some of the most popular trading strategies: breaking through resistance/support levels, getting out of oversold and overbought zones, divergence and pattern formation.
Overbought and oversold zones of the indicator are located at the 0.3 and 0.7 levels. Accordingly, crossing the level of 0.7 downwards by the indicator can be a signal to sell, and crossing the level of 0.3 upwards – a signal to buy.
Divergence is a classic u. oscillators for forex signal, it is also used very effectively with Demarker. If prices are making a new high and the Demarker is showing a new high below the previous one, it is a bullish divergence, which indicates an imminent change from a rising trend to a falling trend. Conversely, if prices are making a new low and the Demarker is showing a higher low than the previous high, it is a bearish divergence and indicates that prices may be entering an up period.
In addition, the indicator can show triple divergence, when the divergence is marked on three extrema in a row and such a signal is considered more accurate than the “normal” divergence. On the chart of the Demark indicator trend lines are indicated, which are built on the highs and lows. When the bottom support line is broken through, it can be a signal to sell. When the upper resistance line is broken through, it can be a signal to buy.
It also forms classical graphical patterns on the chart – “triangle”, “head and shoulders”, “flag”, “wedge” and others. The interpretation of these patterns is different from the interpretation of patterns on the price chart, so to work with them a trader should be trained on demo account and have sufficient experience forex trading.
Trading strategies based on Demark oscillator
The Demark indicator is actively used in many Forex strategies. With its help it is possible to predict the price dynamics on short periods as well as on long ones. In the long term it allows to determine the main trend and helps to filter out false signals.
The oscillator can be used with other Demark indicators, in particular with REI (extended range index, Figure 3), but most often it is used with moving averages of different types:
Image. 3
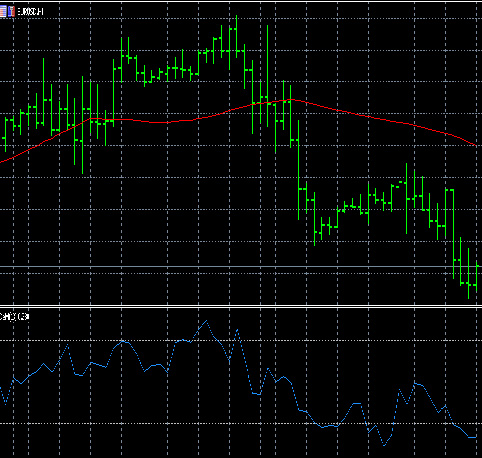
For example, Demarker is used in the strategy with a simple moving average SMA. The strategy is implemented on the 15-minute timeframe. A buy position is opened when the Demarker with values from 0 to 0.3 moves out of the oversold area, with the SMA pointing upwards. A sell position is opened when the Demarker with values from 1 to 0.7 exits the overbought zone and the SMA is directed downwards (Figure 4):
Image. 4
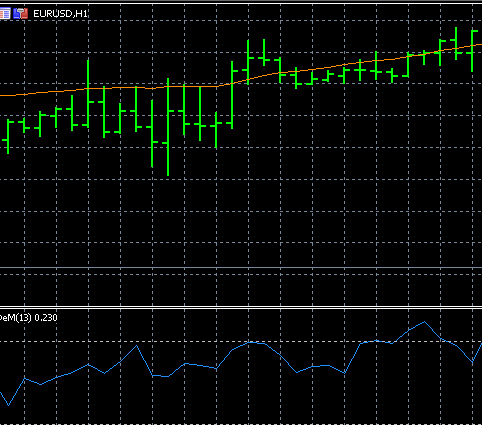
In one of the strategies on a pronounced trend with Demarker indicator is used exponential moving average EMA with a period of 60 (Fig. 5). The price should be below the signal EMA, directed downward. The signal to open a sell position is the Demarker entering the overbought zone and crossing the 0.7 level.
Image. 5
On the contrary, Demarker’s entry into oversold zone with crossing of 0.3 level and placement of upward EMA is a signal to open buy positions.
In a strategy that applies MACD (Figure 6) and Demarker, these indicators complement each other. MACD shows the extremes, the fast and slow moving averages work in it. The fast moving average assesses the short-term trend, the slow one assesses the long-term trend, and the divergence between them confirms the trends.
Image. 6
The Demarker in this strategy is needed to accurately determine entry points. Sell positions are opened when the Demarker is positioned in the overbought zone and the MACD shows the maximum value.
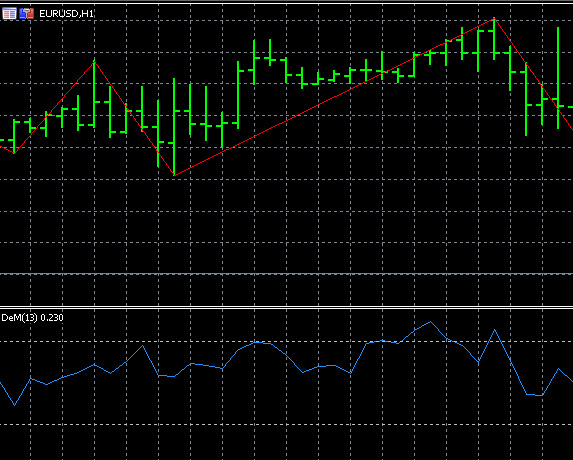
The other strategy besides Demarker and MACD also uses Zigzag Indicator (Fig. 7). It is carried out according to the extremes, cutting off insignificant indicators of the price. Zigzag values, MACD histogram peaks and overbought or oversold zones coincide. Positions are opened on the location of overbought or oversold areas marked by the Demarker indicator. Other indicators confirm this signal.
Image. 8
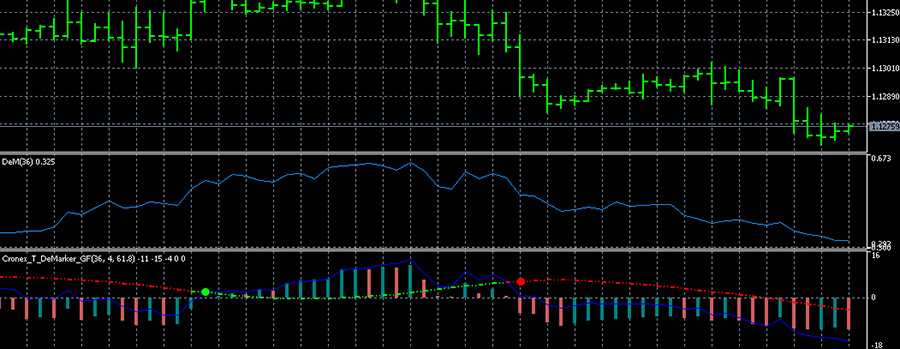
Demarker is a popular oscillator, so it has many different modifications, which are used in various strategies, such as the Cronex T DeMarker version and the Heiken Ashi Smoothed indicator (Fig. 8).
The Heiken Ashi Smoothed indicator is a modification of the standard Heiken AshiIn particular, there is a possibility to change parameters of moving averages and methods of their averaging. This increases the sensitivity of the indicator both when tracking long-term trends and when tracking small price fluctuations. Cronex T DeMarker is a more complex modification of Demarker, which is represented as a histogram of different colors, which is built on the indicators of two moving average lines.
The installation file of Cronex T DeMarker for MT4 can be downloaded through “Market”, and for MT5 you can find the file in third-party sources, checking its security before downloading. The Cronex T DeMarker is loaded on the price chart through the “Catalog” subsection of the “File” section. The indicator is launched after the terminal restart.
In the strategy signals to open positions are given by Heiken Ashi Smoothed, and the indicator serves as their confirmation. The strategy is implemented on timeframes from M15 to H4. In the settings of the Heiken Ashi Smoothed, the MaPeriod parameter is set to 12, the DeMarker parameter is set to 36.
Buy positions are opened when the Heiken Ashi Smoothed shows green candles forming below the price – this means that the trend tends to upward. At the same time on this type of oscillator the blue line of the Cronex T DeMarker crosses the multicolored line from below to above and the indicator forms candles above the zero line.
_
Accordingly, if the Heiken Ashi Smoothed indicator shows red candles above the price, it indicates the formation of a downtrend and is a signal to sell. The signal is confirmed by the blue line of the Cronex T DeMarker crossing the multicolored line downwards.
Demarker can be used in strategies with a very popular indicator Stochastic. For this purpose Demarker with a very long period is used to determine the trend as accurately as possible. Stochastic is used to enter the trend at the end of a period of price correction, taking into account indicators %K – its fast and %D – its slow line.
For example, the Demarker period is set to 50, the signal to open positions will be an exit of the indicator from the zone 0.5. Stochastic is set with the parameters: %D – 6, %K – 20, deceleration – 5. According to the Stochastic, a relatively low price is determined on an uptrend and a relatively high price on a downtrend. The first signal for both selling and buying will be the price movement back in the direction of the main trend after the correction is exhausted. If the Demarker is placed below 0.5, the main line of the Stochastic is moving above the value of 70, the signal line is placed below the main line – this is a signal to sell.
Conclusions
The Demarker oscillator is not quite a standard tool, but it has already gained the respect of traders, because it has many advantages. It is fairly easy to use, it filters false signals well, shows overbought and oversold zones, and allows you to work on graphical patterns.
Demarker confidently shows signals with an unambiguous interpretation, allows you to effectively trade on reversals. It is distinguished by minimal data lag as compared to many other indicators. At the same time, it has some drawbacks typical to oscillators, such as a considerable amount of false signals at the beginning of a trend. That is why it is best used together with other instruments. In this case it is really possible to increase trading efficiency considerably with the help of Demarker.


