Parabolic SAR Indicator
Contents
Parabolic SAR indicator description
Parabolic SAR indicator (SAR, “stop and reverse”, fig. 1) was developed by J. Welles Wilder Jr. technical analysis. Parabolic SAR belongs to the type of trend indicators and is currently one of the most popular ways to determine the trend and reversal in forex trading.
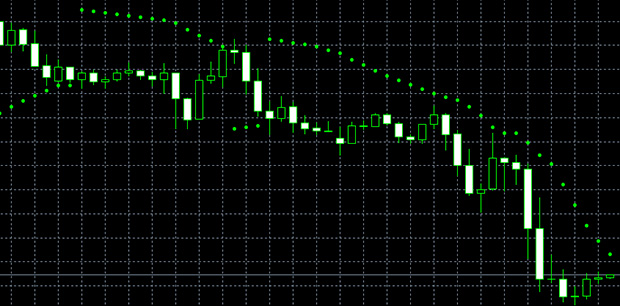
Image. 1
Initially Parabolic SAR was designed to determine the moment of closing a position, which is marked by crossing the indicator line of the price chart. But now its sphere of application is much wider. Parabolic SAR shows the direction trend prices upward and downward for a certain period according to a certain formula with the application of the coefficient and presents it graphically as a parabola consisting of marker points.
Parabolic SAR can show the strength of the trend, because when the trend accelerates, the distance between the markers of the indicator and the price marked candles or bars, on the chart increases. And vice versa, when the trend slows down, the indicator markers approach the price. Parabolic SAR indicator can be effectively used to determine the moments of market entry and exit, in this case it would be optimal to use additional Forex IndicatorsThe Parabolic SAR signals can be confirmed. When trading on a trend, the Parabolic SAR can also be used to place stop losses, moving them to new markers as the position changes.
Setting up the Parabolic SAR indicator is an important moment in its application. In the trading terminals the indicator has two parameters: step of price change and maximum. Optimal are considered parameters for the step – 0.02, and for the maximum – 0.2. These are the most correct values, which can be applied in the vast majority of situations on the market.
But the parameters can be changed depending on the trader’s goals. For example, if the parameters are smaller, the indicator will track rarer and stronger movements. If the parameters are large, there will be more signals, but there will be more false signals.
Log in to your broker’s terminal, add the Parabolic SAR indicator to the chart and see what comes out
| Broker | Bonuses | Open an account |
|---|---|---|
|
1
|
50 %
Bonus on deposit from $100 USD – promo code WELCOME50
|
Start |
|
2
|
5 %
Bonus when depositing via USDT (TRC20)
|
Start |
|
3
|
Cashback
Refunds of commissions, spreads and other costs
|
Start |
|
4
|
15 %
Bonus 15% on deposit by promo code iCGSbEgiAR
|
Start |
|
5
|
100 %
First deposit bonus
|
Start |
Calculation formula
There are two formulas for calculating Parabolic SAR – one for long positions and one for short positions. In both cases we need indicators such as:
- previous SAR, that is, the SAR value for the previous time period;
- EP – extremum (maximum for an uptrend and minimum for a downtrend);
- AF acceleration factor, its standard value is 0.02.
Calculation formulas:
- SAR Up. = previous SAR + previous AF (previous EP + previous SAR).
- SAR down = previous SAR – previous AF (previous SAR – previous EP).
However, there is no need to memorize these formulas for trading, the Parabolic SAR indicator is quite clear.
Advantages of the indicator
Parabolic SAR indicator has the advantage that it has almost no lag and it can be used not only to track the direction of the trend, but also to determine the end of the trend. Therefore, Parabolic SAR is used in many forex trading strategies (The whole truth about forex).
The disadvantages of Parabolic SAR are related to the fact that it generates a lot of false, contradictory signals during the flat period. The indicator is also ineffective for work on the correction and on volatile assets. Its use on a strong steady trend is optimal.
Parabolic SAR Indicator in MetaTrader5
Parabolic SAR is a standard indicator in MetaTrader terminals. In MetaTrader 5 it is in the list of trend indicators (Fig. 2).
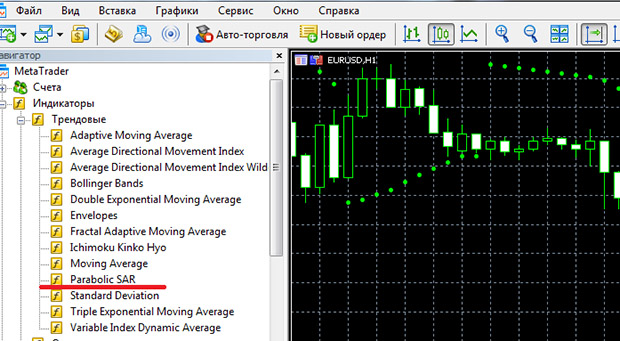
Image. 2
For Parabolic SAR the most popular settings for step and maximum are offered (Fig. 3)
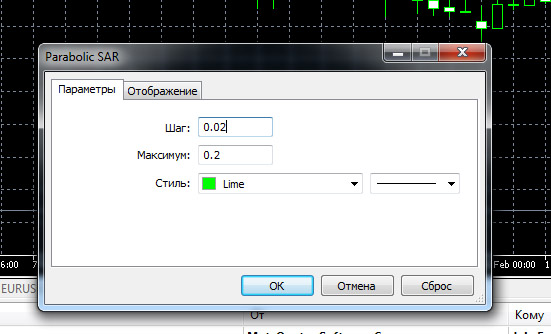
Image. 3
Parabolic SAR indicator in broker terminals
Parabolic SAR indicator is in the terminal for binary options at the broker Binomo (bonus 100% to deposit by promo code REVIEWEEK100 – Activate)) in the list of indicators (Fig. 4), also with the standard settings.
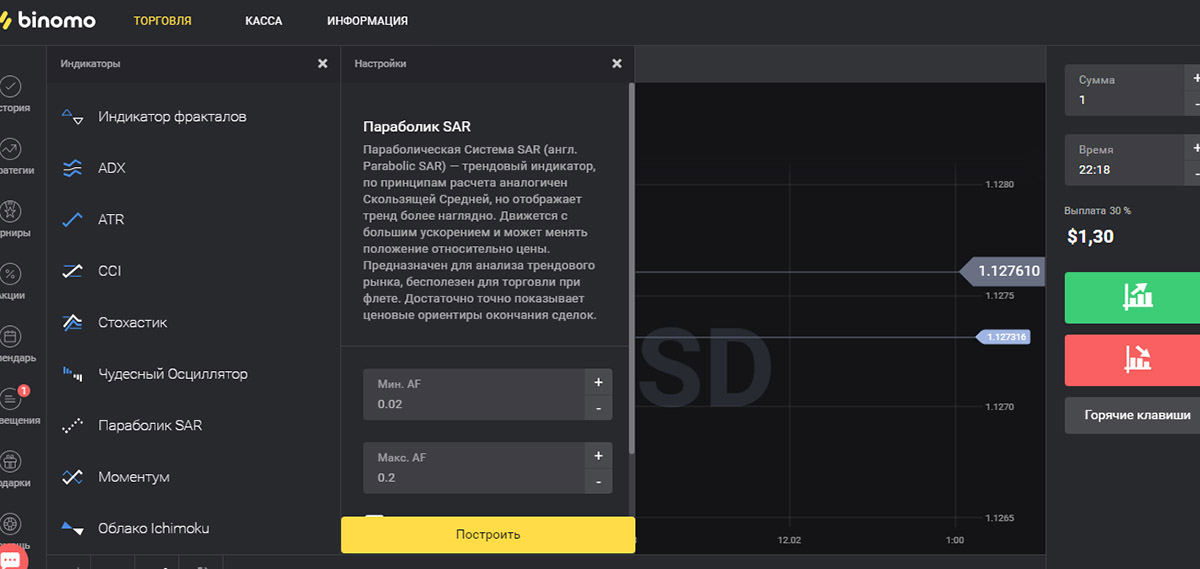
Image. 4
Such Forex brokershow AMarkets (site) use MetaTrader platforms, which have a Parabolic SAR indicator. At Olymp Trade (site) the indicator is represented as Parabolic (Fig. 5). with standard settings.
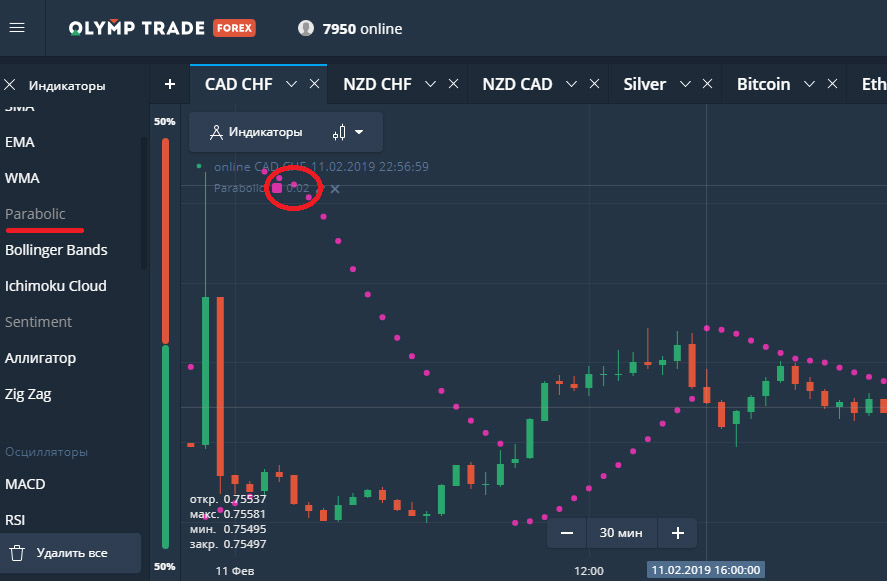
Image. 5
Parabolic SAR Trading Signals
Parabolic SAR indicator gives signals, which, for the most part, are changes in the location of points to the value chart, but not only. For example, if there are large gaps between the markers, the trend is likely to continue further, but strong corrective movements are possible. Accordingly, it is not recommended to open a position when receiving such a signal.
If the distance between the markers is small, it may indicate that a possible reversal is approaching. If the marker point is close to the current price, then you should expect a pullback, after which the trend will continue, or a trend reversal.
Parabolic Sar indicator gives more reliable indicators when trading on long timeframes, starting from one hour. When using it on smaller timeframes, it is necessary to use additional indicators. The basic principle of trading with Parabolic SAR indicator is simple – if the price is higher than the indicator, the trend is upward – opens a sell deal, if the price level is lower than the indicator on the downtrend – opens a buy deal.
If the price crosses the sequence of indicator points, it may indicate the end of a trend and its replacement by another trend. The indicator shows the beginning of the trend without a delay or with a slight delay, but the end of the trend Parabolic SAR shows without a delay.
Most traders do not use Parabolic SAR signals without confirmation by other trend indicators and oscillators for forexThe Parabolic SAR signals are not considered reliable enough, although on a strong trend Parabolic SAR signals are unambiguous enough. Often Parabolic SAR signals are complemented by indicator signals MACD or StochasticsThe additional indicators’ signals do not lag behind the Parabolic SAR signals by more than three markers. It is especially important to use additional indicators during the flat periods of the market to sift out the false Parabolic SAR signals.
Trading strategies with Parabolic SAR
Despite the fact that it is recommended to trade on the Parabolic SAR indicator with additional indicators and oscillators, there is a strategy that uses only one Parabolic SAR. It uses only the signals of this indicator, practically any timeframe and any currency pair. It uses a non-standard step setting of 0.05 and a standard maximum setting.
A buy trade is concluded when the price touches the indicator line from below, a sell trade is concluded when the price touches the indicator line from above. However, this strategy is quite risky and unstable, nothing prevents you from adding an indicator to clarify the trend and entry points, reduce risk and increase profit.
The strategy of trading with Parabolic SAR and MACD (Fig. 6) is one of the well known for the considered indicator. The strategy is implemented on timeframes above M15, not during the flat period, on traditional pairs, such as EUR/USD.
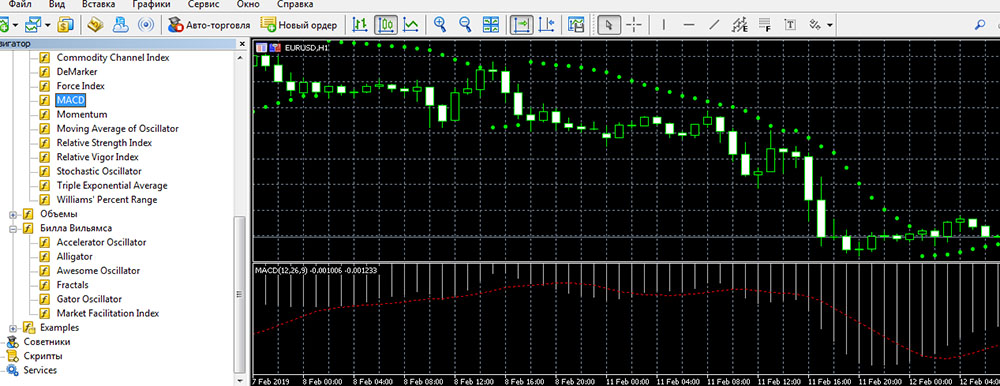
Image. 6
For trading choose the standard Parabolic SAR parameters and standard MACD parameters: fast EMA – 12, slow – 26, MACD SMA – 9 and closing price. To open a buy trade, the Parabolic SAR must be under the price, the MACD histogram must cross the zero line from bottom to top on three Parabolic SAR markers. To open a sell trade, the Parabolic SAR must be above the price and the MACD histogram must cross the nought line from top to bottom on three Parabolic SAR markers. To implement the Parabolic SAR and MACD trading strategy, it is necessary to place Stop Losses, which are set according to the average values volatility.
Another strategy is the combined use of Parabolic SAR and Fibonacci levels. To begin with it is necessary to make sure that the market is dominated by a clearly defined trend. Entry into trading is carried out on indicators Parabolic SAR, for example, when the price breaks through a sequence of points of the indicator from bottom to top, and the markers are under the price, after which there is a rollback, which can open a position to buy. The deal to sell is carried out after the rollback, which occurs after the breakdown of the line Parabolic SAR downwards.
The Fibonacci lines in this strategy are used as a filter for entry signals. The grid is stretched according to the desired extremums depending on the trend. Trades are only entered when the price is at a strong Fibonacci level. One popular strategy is based on the interaction of Parabolic SAR and ADX indicator (Fig. 7). The Average Directional Index indicator was created by the same author as the Parabolic SAR, so they complement each other quite well.
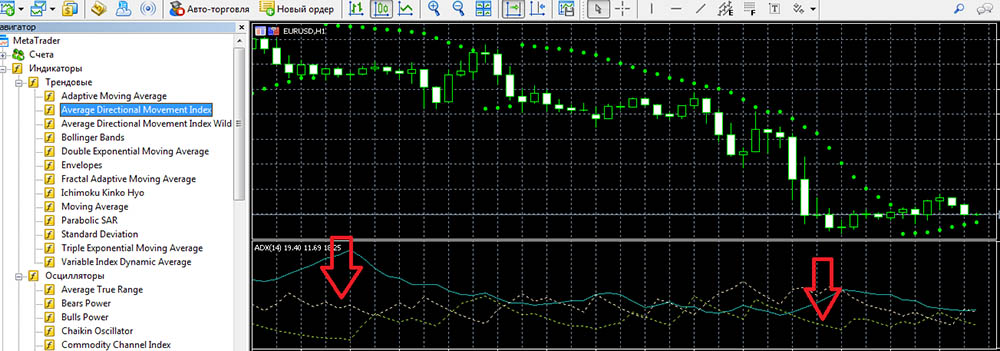
Image. 8
The ADX is needed to filter out false Parabolic SAR signals, it confirms true data. The ADX structure has three lines, the strategy takes into account the lines +DI and -DI. A clear trend should be visible on the chart, trades are opened when both indicators give equally directed signals. The deal to buy opens when +DI is above -DI, and vice versa, when higher is placed -DI – opens a sell deal.
To trade on two indicators – Parabolic SAR and Moving Average HMA (it must be downloaded and installed from a third-party resource), on the second indicator, the parameter 40 is set, select the timeframe M15, the pair EUR/USD. The deal is made when the HMA is directed upwards, and Parabolic SAR indicator points are located below the price. Transaction to sell occurs when the HMA is directed downward, the markers of the Parabolic SAR indicator are located above the price.
The indicator can also be used for scalping strategies. One of these strategies uses, in addition to Parabolic SAR, EMA and MASD indicators. The EMA period is set to 100. The MASD parameters are as follows: 64,128,9. Parabolic SAR is used with non-standard parameters: step – 0.01, maximum – 0.01. The deal to buy is concluded when the Parabolic SAR line is below the price level, the MAASD is in the positive zone, the closing price crosses the EMA from bottom to top. A sell trade is made when the Parabolic SAR line is above the price level, the MACD is in the positive zone and the close price crosses the EMA from above downwards. In general, all strategies with the Parabolic SAR indicator are built one way or another on the ratio of the indicator markers to price.
Conclusions
Parabolic SAR is a standard trend-following indicator, which is popular as a simple and straightforward tool for determining price movements. It has the advantage of not being lagging, but it also has limitations, such as a large number of false signals on the flat. You can trade on the Forex market with Parabolic SAR alone, but applying additional indicators and oscillators is much preferable.