Average Directional Movement Index (ADX) Oscillator
Contents
Description of the Average Directional Movement Index oscillator
The Average Directional Movement Index (ADX, Fig. 1) is an oscillator that determines the strength of a trend. The oscillator is based on the theory of trader Welles Wilder, which he outlined in his book “New concepts in technical trading systems” back in the 70s. 20 в.
ADX is not created as a separate indicator, it is part of a system that also includes a directional movement index (DMI).
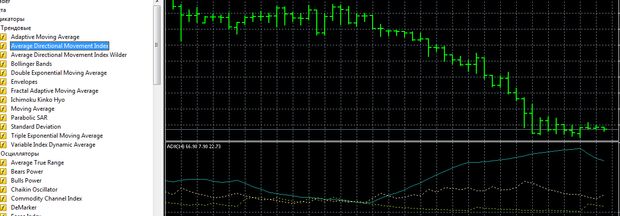
Image 1
The main feature of the ADX oscillator is that it measures only the strength of the trend, but not its direction. Therefore, it is used to determine the beginning of the formation of a new trend.
ADX is forex oscillatorThe value of which ranges from 0 to 100, although movements above 60 are rare. If the value is below 20, then the trend is weak. If the values are above 40, it means that the trend is strong. Accordingly, if the indicator crosses 20 from bottom to top, it indicates a trend is in progress. If 40 is crossed from top to bottom, it means the trend is weakening.
ADX consists of a line plotted on the maximum values of bars +DMI, a line plotted on the minimum values of bars -DMI and, in fact, the line ADX.
The ability of the ADX oscillator to determine the strength of the trend allows you to see the best time to enter the market to buy and sell and the moment of profit taking. Empirically revealed that the ADX functions optimally after a period of consolidation and not particularly well after a sharp movement against a key trend.
It is also practically proven that the most informative signals forex indicator It is applied on timeframes from H4 and beyond, which does not exclude its application on other timeframes, but with less efficiency. The indicator Average Directional Movement Index is quite popular, so it is pre-installed in the trading terminals. For example, in MT5 it is in the list of the main ones in the left navigation panel.
Enter the broker’s terminal, add the ADX oscillator to the graphic and see what comes out
| Broker | Bonuses | Open an account |
|---|---|---|
|
1
|
50 %
Bonus on deposit from $100 USD – promo code WELCOME50
|
Start |
|
2
|
From 25 To 60 %
Deposit increase for the first deposit
|
Start |
|
3
|
Cashback
Refunds of commissions, spreads and other costs
|
Start |
|
4
|
100 USD
Loyalty program remuneration
|
Start |
|
5
|
20 %
Bonus and cashback by promo code revieweek23
|
Start |
Signals of the Average Directional Movement Index
The basic signal indicator ADX – the growth of its values, which shows that there is a trend (Fig. 2). If the rise in ADX values +DI rises above – DI is a signal to buy. If +DI falls below – DI is a signal to sell on rising ADX (forex signals).
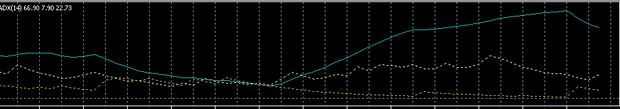
Image 2
If +DI is higher than – DI, while the ADX is decreasing, it means that we need to fix profits. Also need to fix the outcome when +DI is located below – DI with declining ADX. Also a signal to fix the profit is when the indicator reaches the 50 mark, as such values indicate that the trend is exhausted.
If the ADX rises from below 15 and crosses +DI or – DI, this confirms an existing trend. A series of ADX peaks that are visually traceable are informative. For example, a series of peaks, each higher than the previous one, indicates that the strength of the trend is increasing. A series of decreasing peaks indicates a decrease in trend strength.
When working on ADX signals, you need to remember the rule of extremes, which was developed by Wells Wilder for this indicator. The extreme point at the appearance of a buy signal is the maximum price of the day of crossing, at the signal to sell, respectively, the minimum price. The extreme point serves to clarify the market entry conditions (Forex Trading).
Thus, buy positions are opened when the price is above the extreme point, and sell positions are opened when the price is below the extreme point. If the price does not cross the extreme point, it is considered irrational to start trading.
Strategies with ADX
The simplest strategy using the Average Directional Movement Index is to identify the emergence of a trend and monitor the behavior of the indicator, independently deciding when and what positions to open, based on the strength of the trend. But this strategy is not reliable, that’s why ADX is used with other indicators (forex strategies).
The strategy (Fig. 3) with the use of ADX and MACD indicators is carried out on the timeframe of M15 and above. The following parameters are set: ADX(14), MACD(5,25,9), MA(9), in addition, a simple moving average with a period of 9 is set.
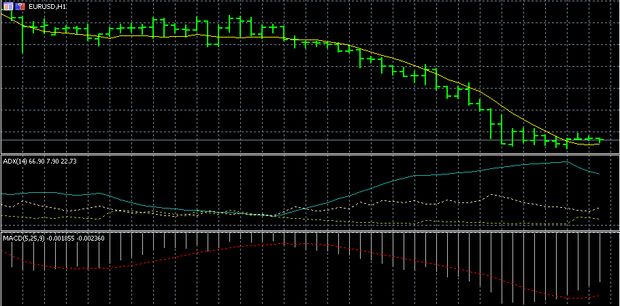
Image 3
The main indicator in the implementation of the strategy will be MACDwhich will show the direction of trading. ADX indicator is adjusted so that the lines of signals DI- DI + were not visible on the chart. The moving average MA (9) is superimposed on the ADX.
The signal to buy would be a cross of ADX c MA from the bottom to the top with a positive MACD. If the MACD value is negative, it will be a signal to sell. Then the following signals are evaluated – if the subsequent signal is opposite to the previous one, the trade is closed. If a signal coincides with the previous one, a new order is opened.
The other strategy (Fig. 4) uses ADX and the ATR indicator. Recall that the ATR (Average True Range) indicator shows the volatility by the rangeA of maximum and minimum price fluctuations and closing prices. This indicator is also developed by Wilder.
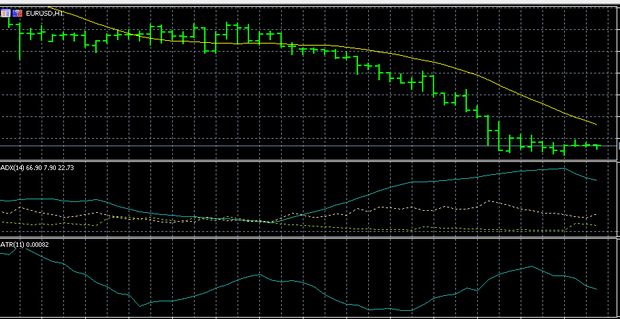
Image 4
Indicators are set with the parameters ATR (11), moving average with a period of 21 is superimposed on the ATR, ADX (14). The signal to buy is when the ADX indicator is above 25, when the ATR indicator is above the MA, and +DI must cross -DI. The signal to sell is the location of the ADX indicator above 25, placing the ATR indicator below the moving average and DI must cross +DI.
The following strategy (Fig. 5) is built on the ADX and two exponential moving averages. The EMA with period 4, EMA with period 11, ADX with period 13 – you should pay attention to this, because the standard period of ADX 14.
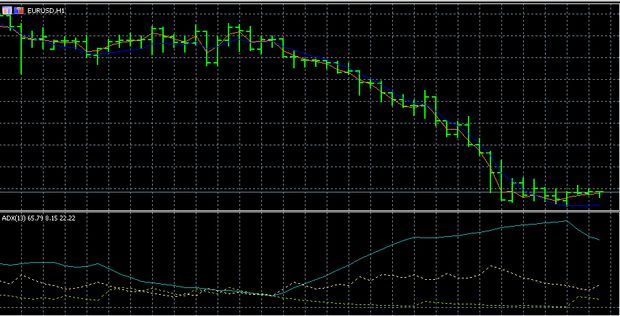
Image 5
The signal to buy would be +DI above -DI, the ADX indicator should be placed above the level of 22, and the EMA (4) should cross from bottom to top EMA (11). To open a position, it is important that all three conditions described are fully met.
To open a sell order, +DI should be placed below -DI, the ADX indicator should be placed above level 22 and the EMA (4) should cross the EMA (11) from bottom to top. To close the position is assumed when the EMAs are crossed in the direction opposite to the signal.
The following strategy (Fig. 6) uses the Stochastic Oscillator and exponential moving averages together with ADX. The strategy is designed for the timeframe M15 and above. ADX settings parameters are standard – period 14, level 20. EMA with periods of 30, 15 and 5 are also applied to the chart. Stochastic is set with an additional level 50.
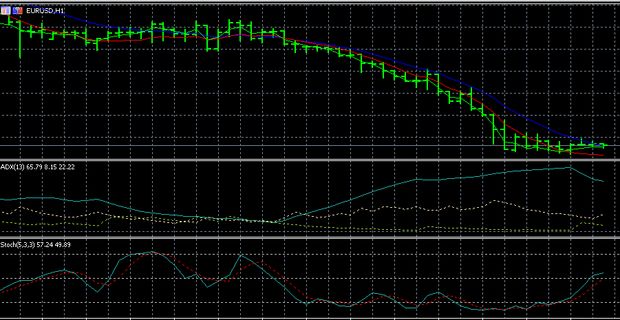
Image 6
Sell positions are opened when the ADX crosses the 20 level from bottom to top, there is an order of the following, from bottom to top: EMA (5), EMA (15), EMA (30) from bottom to top, with stochastics crossing the 50 level from top to bottom. Buy positions are opened in opposite conditions for all indicators, except for ADX, which, as in the first case, must cross the 20 level from bottom to top.
There is also a strategy in which the ADX is complemented by a simple MA, which is optimally implemented in a period when the ADX is rising. And there is a strategy in which the ADX is paired only with a stochastic. In this case the optimum results will work in a flat movement, if there is an increase in the trend – which can be seen on the ADX, then the stochastics will generate false signals.
There is a strategy that uses together with ADX and EMA indicator RSI. The strategy is implemented on the timeframe of H1 and above. Recall, RSI is a relative strength index, it was also developed by Wilder. The RSI indicates whether an asset is oversold or overbought. In this strategy, the RSI is used with a period of 25 or 14. ADX is used with standard parameters.
Buy positions are opened when prices remain above the EMA (20), the RSI line is above 50 but below 70, and the main ADX line is above the 20 level. Sell positions in this strategy are opened when prices remain below the EMA (20), the RSI line is below 50 but above 30, and the main ADX line is also above 20. Only one position can be opened in this strategy, and the next position can be closed only after the previous one has fully worked out.
The ADX indicator is used in the strategy with Parabolic SAR (PSAR). The strategy uses +DI, -DI lines. Parameters for the Parabolic are 0.02; 0.2, the ADX is set to the 50 level. Buy positions are opened when the +DI line is above -DI and the PSAR shows that a long position can be opened. Sell positions are opened when +DI line is above -DI and the signal is confirmed by the Parabolic. If the +DI and -DI lines cross again and the ADX shows a cross of 25, you should exit the trade.
Another strategy (Fig. 7) uses together with the ADX indicator Stochastic and such a tool as Heiken Ashi. Indicator Heiken Ashi is a variation of the Japanese candlesticks, which has more accurate signals. The strategy is implemented on the timeframe of M5 and above. The ADX indicator is set with a period of 14, stochastic parameters 5, 3, 3.
Buy positions are opened when the price is above the moving average Heiken Ashi, and the chart shows two bars which show an upward trend. The ADX should be placed above 20, stochastic should be pointing up. To enter to sell, the price should be below the moving average Heiken Ashi, and the chart shows two bars, which show a downtrend. ADX is placed below 20, stochastic shows a downward movement.
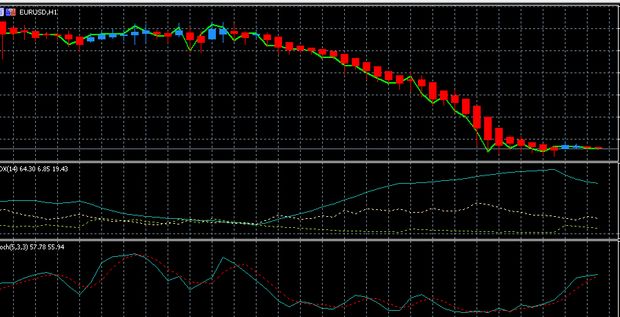
Image 7
Conclusions
ADX indicator can be very useful in trading, as it allows you to do a very important job: to determine the beginning and end of the trend. This significantly reduces the risks when trading. Also ADX indicator is effective as a filter in multi-indicator strategies.
However, the ADX has a number of serious drawbacks to consider when working with it. In general, the indicator is unreliable during long trends or when there is high volatility, but it is not clear where the trend is moving. In addition, false signals are very often crossing -DI and +DI, in all conditions.
In practice, it has been proven that the ADX is quite informative and accurate only if a flat movement prevailed before the formation of the trend. ADX can give signals with a long delay, because the formula of the indicator implies a double smoothing of the data.
The effectiveness of such a tool as the Average Directional Movement Index (ADX) is estimated at only 60%. Therefore, it can only be used in conjunction with other indicators.