On Balance Volume Indicator (On Balance Volume)
Contents
Description of the Balance Volume Indicator
The trend indicator On Balance Volume was introduced by the famous trading theorist and practitioner Joseph Granville in his book “New Strategy on the Stock Market” back in 1963, but even today this indicator remains relevant and one of the most popular.
In creating the On Balance Volume indicator (Fig. 1) Granville assumed that volume is the driving force of the financial markets, and volume parameters can be used to build strategies.
Specifically, Granville observed that when volume rises or falls sharply, there will soon be a change in the price of an asset. This happens because the big players make volume purchases while the small players sell. When the big players have “bought up” enough, they send the price storming to new heights.
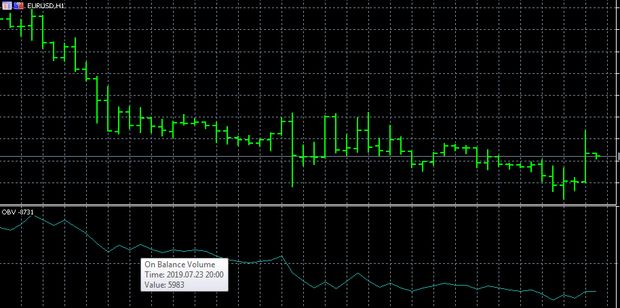
Image 1
The On Balance Volume formula is simple and is given in many sources:
If, for example, today’s closing price is higher than yesterday’s closing price, the OBV is equal to the sum of the previous OBV and the volume of this period: OBV i = OBV i-1 + Volume i;
If today’s closing price is lower than yesterday’s closing price, the OBV is equal to the difference of the previous OBV and the volume of this period: OBV i = OBV i-1 – Volume i;
If yesterday’s and today’s closing prices are equal, then the OBV is equal to the previous OBV: OBV i = OBV i-1.
Where:
OBV i – On Balance Volume for the current period;
OBV i-1 – On Balance Volume for the previous period;
VOLUME i – volume of the current candle.
The key feature of the indicator is that it operates only with trading volumes, not with prices. Prices for On Balance Volume matter only as an additional parameter.
Graphically, the indicator looks (Fig. 2) as a curve, which shows the dynamics of the accumulation of trading volume.
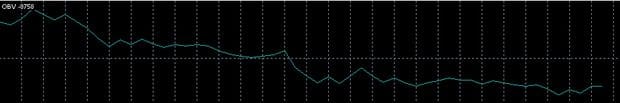
Image 2
OBV calculation does not imply averaging, so its indicators are synchronous to the price and can be ahead of the price. Based on its features, On Balance Volume (OBV) is used to determine the main market trend and to determine trend reversals ahead of time.
OBV is a simple enough indicator, and the only adjustable parameter in terminals is the prices of periods – closing or opening prices, extrema, median prices. It is believed that the most effective use of the indicator on timeframes hourly, 4-hour daily and weekly.
Log in to your broker’s terminal, add the On Balance Volume indicator to the chart and see what comes out
| Broker | Bonuses | Open an account |
|---|---|---|
|
1
|
50 %
Bonus on deposit from $100 USD – promo code WELCOME50
|
Start |
|
2
|
From 25 To 60 %
Deposit increase for the first deposit
|
Start |
|
3
|
Cashback
Refunds of commissions, spreads and other costs
|
Start |
|
4
|
100 USD
Loyalty program remuneration
|
Start |
|
5
|
20 %
Bonus and cashback by promo code revieweek23
|
Start |
Applications and Signals On Balance Volume
The use of volume indicators in forex trading causes difficulties. These indicators were created for the stock exchange, where you can see the volume of the traded asset. In forex, you can’t see what currency is being bought or sold during trading. Volume indicators are needed to determine the volume of trades, volume indicators will not tell you anything about the direction.
The interpretation of indicator signals itself is not very clear, but there are a number of rules of interpretation for forex trading. So, if trading volumes decrease (Fig. 3), it means that interest to the pair decreases and it may presage either change of trend or price stabilization. On the contrary, if the volume of trade operations grows, it means that the interest to the pair increases and it can mean either strengthening of the trend or reversal.Forex Trading Training)
With a gradual reduction in trading volumes long enough, you can expect a sharp change in price.
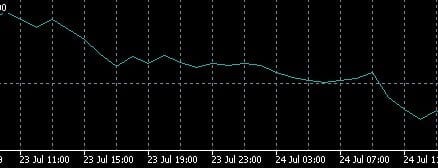
Image 3
If you can see peaks on the indicator charts, you can expect a trend reversal soon.
These are quite fuzzy signals, which can be interpreted very broadly. Therefore such tools are used with additional indicators. Specifically the OBV indicator can give several types of signals. So, if the OBV indicator updates extremums consistently according to the main trend, the trend will continue further.
If the price rises faster than On Balance Volume updates extrema, it means that the trend is not confirmed by the growth of volumes and it is likely to return to its previous values. If the price updates extrema but the OBV does not, it means that the trend is fading and we should wait for the reversal. Many traders believe that in reality, the On Balance Volume indicator gives only one meaningful signal – exactly on the trend reversal.
Divergences in the indicator and price dynamics are called divergences. The OBV indicator can show bullish and bearish divergences. A bullish divergence signal is when the subsequent peak is higher than the previous one, but the price chart gives the next peak lower than the previous one. A bearish divergence signal – when the indicator shows the next peak lower than the previous one, but the price chart shows the next peak higher than the previous one.
When there is a sharp change in trading volume, it is displayed on the OBV indicator as a sharp rise or fall of the line. If a sharp change is noted at a local high after a rapid rise in prices or at a local low after a rapid decline in prices, this is a signal for a trend reversal. The reversal is confirmed by an additional OBV signal in the same direction. Optimally, if such signals appear at important resistance and support levels, then they can be used to enter the trade.
If the indicator moves long enough without peaks and troughs (Fig. 4) in a conditional “corridor” of indicators, it shows the uncertainty of the trend. It ends with a change of trend to upward or downward, this moment is called a breakthrough.
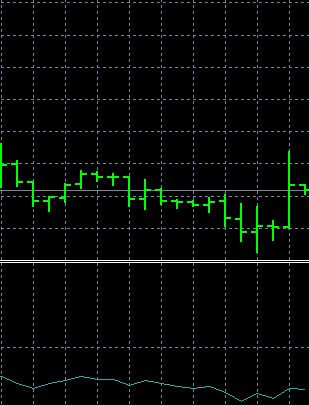
Image 4
At the same time, an uptrend is considered an uptrend even if the uptrend changes indefinitely again and remains so for two periods, and then returns to an uptrend.
In any case, the OBV indicator often generates false signals, so you should wait for confirmation over several periods in which you can see whether the indicator continues a given movement or not. When a breakout occurs, the signal to buy will be a reversal of the indicator upwards, and the signal to sell will be a reversal of the indicator downwards.
It is believed that a position opened by the OBV signals must be held until the complete change of the trend. Even if the OVB indicator generates understandable signals, they are still not very accurate to rely only on them to open positions. The optimal thing is to use the OVB to confirm the strength or weakness of the trend and to see a reversal. Everything else is done with other indicators and oscillators. In addition, it is proven in practice that it is necessary to apply On Balance Volume only on daily charts.
In the Balance Volume Terminal
The OBV indicator is included in the list of standard for trading platforms. In particular, in MT5 it is located in the navigation bar among other volume indicators. In the settings you can change the type of information – by ticks or real volume and mark levels of the indicator, as well as change the style of display (Fig. 5).
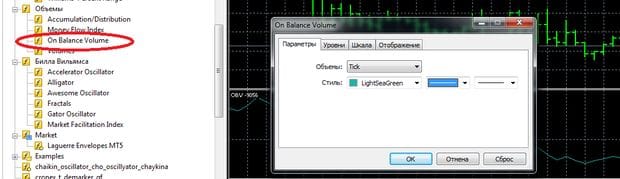
Image 5
Trading strategies based on On Balance Volume
One example of the use of On Balance Volume is in strategies with the RSI indicator (Fig. 6) during the flat movement. RSI indicator (Relative Strength Index) shows “momentum” – the speed and amplitude of price change, i.e. it shows the strength of the trend and the probability of reversal.
In the strategy, the OBV indicator is used to identify the breakdown of support and resistance lines when the flat ends and a new trend is formed. When the OBV gives the appropriate signal, positions are opened when the RSI indicator exits overbought/oversold zones in the direction of the new trend. Accordingly, buying is done in an uptrend and selling is done in a downtrend.
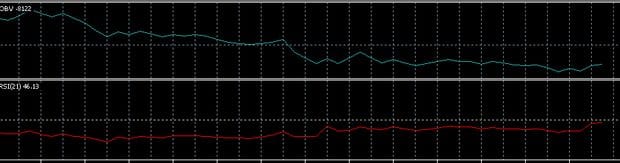
Image 6
Only during the flat, the strategy is implemented in which the OBV indicator is supplemented by stochastics. The flat trend is set using a volume indicator, the moment of price placement in one of the overbought or oversold zones is determined by stochastics with standard settings. This system works best on low volatility assets.
The most common strategy used is On Balance Volume combined with a simple MA moving average. Volume is placed on the chart, then the MA, for example, with a period of 120. The MA gives simple clear signals, if it is directed upwards, the market is dominated by buyers, if it is directed downwards, the market is dominated by sellers.
The OBV indicator allows signals to clarify and more confidently open orders. Thus, the signal to buy will be a crossing of the line On Balance Volume moving average from the bottom up. On the contrary, a signal to sell will be a crossing of the moving average by the volume indicator from top to bottom. It is possible to add any other indicator to this strategy, which would give confirmation signals for order placement.
The same approach is practiced in combination with other trend indicators, such as CCI. With other volume indicators OBV will allow to analyze the situation on the market more accurately and thus effectively place orders. For example, there is a strategy that uses OBV and A/D, Accumulation/Distribution indicator.
Some traders claim that it is possible to use On Balance Volume for paradoxical trading in which some abnormal indicator reading is noted. It is seen as an indicator of most traders’ error and may indicate a trend reversal. Under the terms of this strategy, such an anomaly is a signal to enter the trade against the trend.
Conclusions
The Balance Volume Indicator (OBV) is a simple, but quite informative and useful tool that gives a clearer picture of what is happening in the market. The main advantage of the indicator for trading is that it can generate anticipatory signals and it can be used to build trading systems in combination with other indicators.
As a signal provider, this indicator is most effective when trading on medium and long term timeframes. But working only with OBV is problematic and if it is carried out, some traders recommend to implement the strategy with two indicators on two screens with different timeframes. From the disadvantages it can be noted that this indicator was created for the stock market, it can generate a lot of false signals during forex trading.
Often the difficulty for traders is to understand that the numerical values of the indicator have no practical value and one must look at the behavior of the curve. By and large, the Balance Volume (OBV) is most useful as a tool that provides information for reflection, not for making trades with it.