Zigzag Indicator
Contents
Description of the Zigzag indicator
When analyzing price movements on the graphic in forex trading The trader can be hindered by insignificant price fluctuations – market noise. It is difficult for him to see really significant trends and it is easy to make a false forecast.
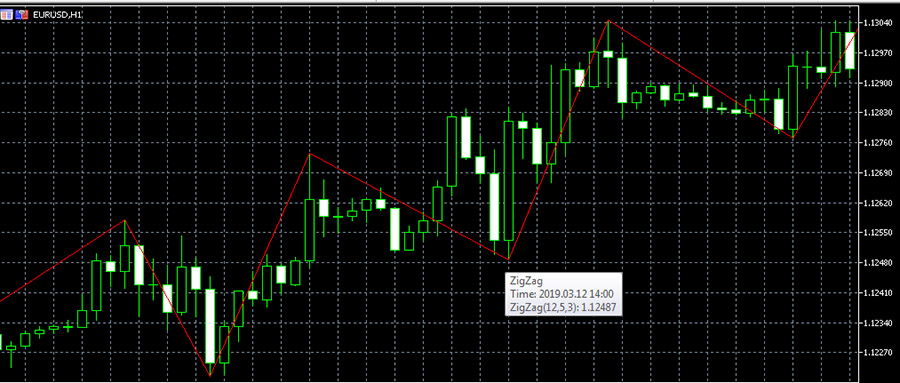
This one forex indicator (Fig. 1) allows to cut off the price noise and more accurately identify the key trend and significant price changes, reversals and other important trend changes. In general, with the ZigZag indicator it is possible to evaluate the market situation more effectively (The whole truth about forex).
In particular, it simplifies the construction of trend lines, makes it easy to find support and resistance levels, shows a bounce of the price from the levels. Traders based on ZigZag information are looking for Forex Signals market to buy and sell (Forex Trading Training).
At the same time, the ZigZag marks the price changes in the past – on the basis of this information, the trader can get more accurate forex forecast. But ZigZag is rarely used as an independent tool – it is an additional indicator to other tools, including oscillators for forex.
How does ZigZag work? The indicator determines the most significant high and low price points and connects them with straight lines. Thus, unnecessary insignificant fluctuations remain unnoticed by the trader. The indicator looks like a broken line superimposed on the main chart. It uses the fluctuation of the price as an estimate and filters out fluctuations outside this value. For example, if the value of the filter is 10%, then everything less than 10% will not be marked as insignificant.
The trader should closely monitor the behavior of the indicator, because its last line may change when the tracked data changes. This is one of its drawbacks. For example, it marks the lower extremum. However, if the trend remains downtrending, the indicator shifts the line lower and the indicators are redrawn. If the trend changes to an uptrend, the indicator marks the upper extremum and redraws the values again. Because of this feature of the ZigZag, it is reasonable to use it on timeframes from 1 hour.
Log in to your broker’s terminal, add the ZigZag indicator to the chart and see what happens
| Broker | Bonuses | Open an account |
|---|---|---|
|
1
|
50 %
Bonus on deposit from $100 USD – promo code WELCOME50
|
Start |
|
2
|
From 25 To 60 %
Deposit increase for the first deposit
|
Start |
|
3
|
Cashback
Refunds of commissions, spreads and other costs
|
Start |
|
4
|
100 USD
Loyalty program remuneration
|
Start |
|
5
|
20 %
Bonus and cashback by promo code revieweek23
|
Start |
Indicator settings
ZigZag has three parameters: Deviation, Depth, and Backstep. Let’s talk about them in more detail.
- Deviation (deviation) is the minimum number of points, expressed as a percentage, between the extremes of two neighboring candles. As a rule, this value is 5%. This parameter forms local extrema. That is, price movements of 5% and above are marked by the indicator, lower values are cut off.
- Depth (depth) – shows the required minimum number of candlesticks for identifying extrema. Accordingly, the smaller this value is, the more responsive the indicator is.
- Backstep (reverse step) – shows the minimum amount between minima and maxima.
Changing the indicator parameters affects the sensitivity of the tool: if we decrease the parameters, the indicator will show more lines, displaying more points of extremums. The preset parameters of the tool are quite correct and it is not recommended to change them.
Advantages of the ZigZag indicator
ZigZag indicator is used in combination with other tools technical analysis, this is exactly the kind of use that is effective. It is often used in strategies with Elliott wave counting, using Bollinger Bands, Fibonacci levels to determine standard patterns.
For example, it is a trend pattern “bottom-correction-bounce” (1-2-3), which is formed at the end of a trend and indicates a change in the trend. This pattern is easily identified with the ZigZag indicator and allows predicting the entry point into trades with great accuracy.
The ZigZag is mostly used by traders who work according to Elliott Theory, as it helps to identify Elliott waves without plotting them on a chart. The main price movement, according to the Elliott Theory, is an impulse wave in the trend direction, interspersed with corrections. ZigZag allows you to determine the first impulse wave and enter the trade under optimal conditions.
ZigZag is often used together with Bollinger lines according to a fairly simple technique. If there is an angular bend in the Bollinger lines on an uptrend, a line is drawn from the previous top of the ZigZag through the bottom point of the Bollinger bend to touch the bottom line. The indicator allows you to determine the appropriate entry point to buy an asset.
ZigZag indicator in the MetaTrader 5 platform
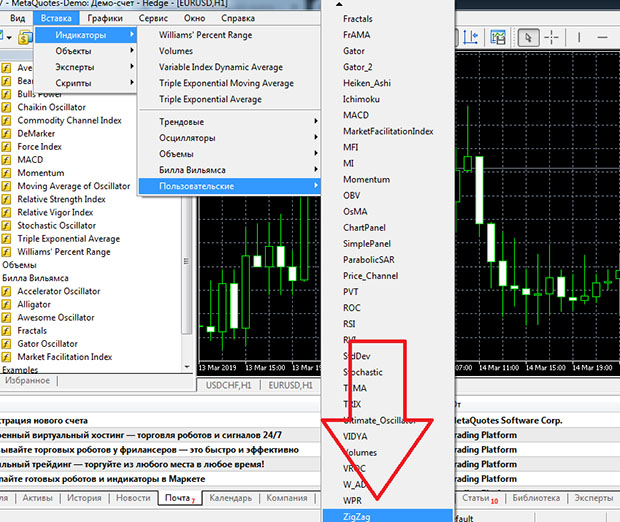
The ZigZag indicator is a popular trading tool. For example, in the MetaTrader 5 terminal it is located in the “Custom” tab. In order to load it on a chart, you need to enter the “Insert” tab, at the bottom of the tab go to “Custom” and find the indicator in the pop-up menu (Figure 2). Or you can do it by going to the main list of tools on the left side of the chart, in the “Examples” tab:
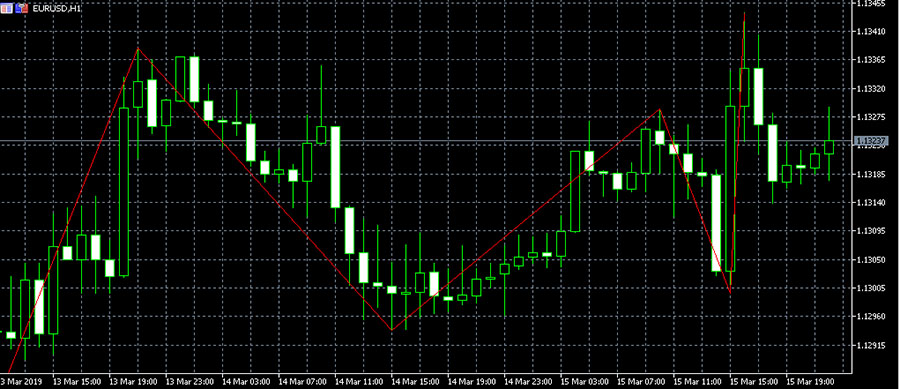
After clicking on it on the chart the window of indicator settings will appear, where Deviation – 5, Depth – 12, Backstep – 3 are set by default, also timeframe and indicator color can be changed here. If you leave these parameters or set your own, you can load ZigZag on the chart (fig. 3):
Trading strategies based on ZigZag
Despite the fact that ZigZag is used with other indicators, there are strategies in which only it is used. It is used to mark a minimum on the chart, it should be confirmed by two candles or more on the trend. This can be a signal to buy the asset with stop losses up to 10 points below the low.
For a signal to sell you need to set a maximum, confirmed by several candles – the entry is made with a stop-loss up to 10 points above the maximum. Trading is preferred on timeframes of 15 minutes or more. Despite the apparent simplicity, this strategy is not often used, because still one indicator is not enough for a full-fledged trade, in addition, the indicator lags, but in principle trade only on the ZigZag is possible.
The same can be said about the strategy based on the ZigZag indicator for breakout, also with the use of stop-losses. It involves opening positions on the breakdown of extrema, stop-losses are set up to 15 points above or below, depending on whether the asset is bought or sold.
The ZigZag property of simplifying the identification of basic price movements is used in strategies related to the construction of patterns on the chart. For example, ZigZag is used to build one of the basic chart patterns – a triangle. For this purpose, ZigZag determines two upper and two lower points, so that the upper point is lower than the first one, the second lower point is higher than the first one. The trades are opened on the breakdown at the point of the forecasted price breakdown of the pattern’s borders – both for sale and for purchase.
One of the popular strategies is trading by ZigZag and moving average. A buy trade opens when the ZigZag crosses a moving average from bottom to top and on the mark by the indicator of the maximum immediately after the minimum. A sell trade opens when the indicator shows the first low after the high when the ZigZag crosses the moving average from top to bottom. This strategy requires the use of stop losses, placing them up to 40 pips depending on the trend.
The Elliott Wave trading strategy using ZigZag involves identifying the main waves. The main waves A and C develop in the direction of the key trend with corrective movements B and D. A sell order is opened immediately after the completion of the B-C correction before the D impulse. Strategies with Elliott waves often use the Fibonacci grid, which allows specifying corrective movements of waves and opening a trade on the formed trend. In addition, the ZigZag in the wave strategy can confirm a trend reversal after the completion of the correction.
As part of a strategy that uses ZigZag, Fibonacci, and MACDThe indicator shows the movements of the price, the Fibonacci grid is superimposed on the “waves” according to which the price is moving. The indicator shows the price movements, the Fibonacci grid is superimposed on the “waves” according to which the price moves, and the MACD indicator shows divergences and convergences, which mark the end of the current trend.
This strategy first determines the price dynamics using the MACD. If it indicates a change in the trend, then the ZigZag price wave is determined and the Fibonacci levels are superimposed on it. Trading positions are opened using the Fibonacci levels in the direction indicated by the MACD. This strategy also involves the use of stop losses.
It is believed that this is a fairly versatile strategy that can be used in almost any market situation, including when the flat trend prevails, but the effectiveness of trading is higher in a volatile market, because in this case, there are more signals.
Long-term strategy, in which the ZigZag indicator is used together with indicators Stochastic or RSI, designed to determine the correction after a trend reversal and after exiting the flat. Additional indicators should show overbought and oversold zones to determine the beginning of a possible trend change. The trader identifies new extrema and opens sell or buy trades depending on the emerging trend. The trades are closed only when the indicators show another change in the trend. The strategy is implemented with the support of stop-losses.
The ZigZag indicator is also used in Williams strategies, the tools of which are in the list of standard in the trading terminals. Within the framework of these strategies, the following indicators are used Alligator (Fig. 4), AC (Acceleration/Deceleration), and Wonderful Oscillator (Awesome Oscillator):
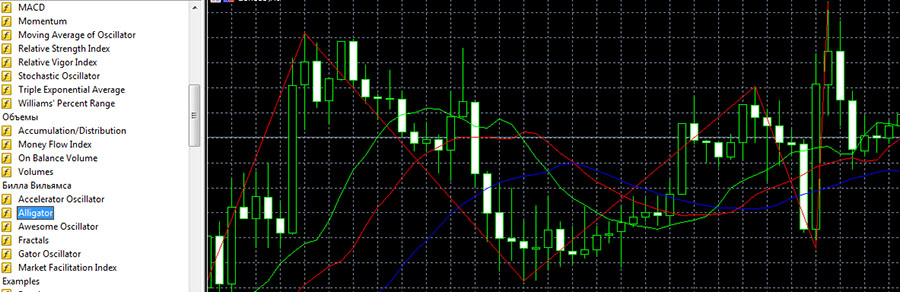
The trader marks the Alligator indicator patterns: if the pattern is above the three indicator lines, it is a signal to buy, if below – to sell. The Awesome Oscillator and Acceleration/Deceleration indicators confirm the signals of the previous indicator by color and oscillator position, for example, green and above zero confirm a signal to buy. The ZigZag in this strategy allows to cut off the market noise and quickly assess the trend reversal.
Conclusions
The ZigZag indicator is successfully used in various strategies. Its main task is to clarify the trend movements, cutting off unnecessary signals and thus increasing the accuracy of forecasts. But it is not predictable on its own, since it analyzes only the past price movements and, moreover, overdraws the latest data. That is why it is used in combination with other indicators and trading tools.