MACD Oscillator
Contents
- 1 MACD oscillator description
- 2 Calculation formula
- 3 Advantages of the oscillator
- 4 How to add MACD to MetaTrader 4?
- 5 How to add MACD to MetaTrader 5?
- 6 How to add MACD to the broker’s terminal?
- 7 How to install the oscillator in the terminal?
- 8 MACD trading signals
- 9 MACD signals in Metatrader 5
- 10 MACD signals in Binomo
- 11 MACD Signals at Expertoption
- 12 Strategies with MACD
MACD oscillator description
Among the great variety of instruments offered for work in the market binary options tradingThere are some that are popular with most players, as they are not only simple, but also successful in meeting the goals set for them. The MACD is among such tools that can help the player in finding reliable information about the mood of assets.
Moving Average Convergence/Divergence (convergence/divergence) is a typical example of one of the most common trend oscillators for binary optionsThe role of the indicator. Its author is J. Appel, who developed it in 1979 for working with stocks. And to this day, although a lot of attractive tools have appeared during this long time, it has not lost its relevance, it is still actively used as an oscillator, an indicator, a separate strategies and as an important tool for both simple and complex trading systems. This classic oscillator is simple, flexible in its settings, and its data is easy to read and make the right positions to invest not only in options, but also in forex. Like other similar tools, the MACD is plotted on the chart in a separate field, which is, of course, convenient for work.
The tool is based on the use of 2 sliding which are not displayed on the graph, only their readings are recorded here. So, it determines how they have converged/diverged. It is displayed on the chart as a histogram with a line: the role of the histogram is to show the parameters of divergence of the same sliding bars (the bars grow when one slides away from the other and vice versa). Thus, in case of a strong trend the bars are long, in case of a flat – on the contrary, they are short. The peculiarity and one of the advantages of this tool – is that you can see the entry opportunities and use them faster than other traders. Due to the fact that the data here is fed in advance, which is due to the early appearance of divergences on the chart, it can be used to anticipate the moments of reversals.
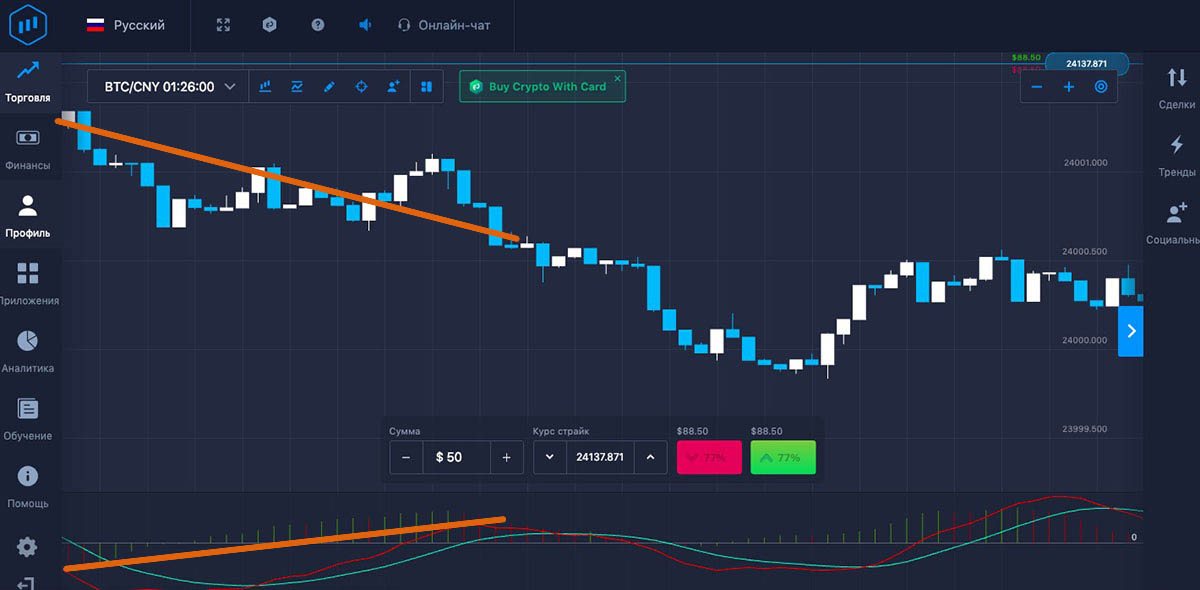
Log into your broker’s terminal, add the MACD oscillator to the chart and see what comes out
| Broker | Bonuses | Open an account |
|---|---|---|
|
1
|
50 %
Bonus on deposit from $100 USD – promo code WELCOME50
|
Start |
|
2
|
5 %
Bonus when depositing via USDT (TRC20)
|
Start |
|
3
|
Cashback
Refunds of commissions, spreads and other costs
|
Start |
|
4
|
15 %
Bonus 15% on deposit by promo code iCGSbEgiAR
|
Start |
|
5
|
100 %
First deposit bonus
|
Start |
Calculation formula
MACD = EMA (CLOSE, 12) – EMA (CLOSE, 26)
SIGNAL = SMA (MACD, 9), where:
EMA – exponential kind of sliding,
SMA – a simple kind of sliding,
SIGNAL – signal muving.
Advantages of the oscillator
As we wrote above, today it is one of the tools often used by players to analyze the dynamics of assets. Moreover, it is hard to imagine market research work without it, because it allows you to track market sentiment and enter trades when it is really profitable. It will be easy to work both for professionals and beginners, which, of course, is also its advantage.
The thing is that it manages to combine both information about the trend and impulse indicators. It is indispensable for identifying extrema and crossovers. In addition, we can confidently consider this tool to be almost one of the best tools today, because it generates a sufficient amount of material valuable for work: it includes information about the mood of different parties involved in trading, and data on possible reversals, divergences, etc.
It can be used in the strategy when working with any assets, on any time ranges (it is both short-term and long-term investments). Due to the fact that its work is based on slides, it is able to generate data on the current market sentiment. It also allows the MACD to deliver its data in advance, which is especially important during trading. This tool will be a good assistant to the trader both when one of the sides of the market is active and when it is flat. Thanks to the work with the divergences/convergences it is possible to work with signalsanticipating the coming of a new trend. It is easy to work with, and its data is easy to interpret – you do not need to have impressive trading experience (Binary options trading training).
How to add MACD to MetaTrader 4?
In this program, the oscillator is available immediately after installation, which is convenient. Working in the legendary trading software is simple and straightforward. In order to add the MACD to the main workspace, you need to go this way: “Insert” – “Indicators” – “Oscillators”. Having selected it for work, here you can also configure it:
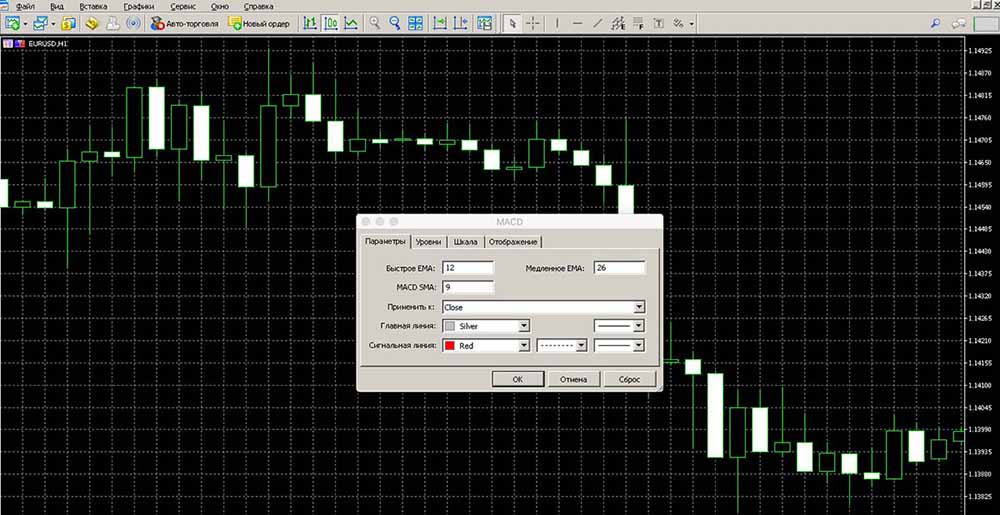
Then, by pressing the “OK” button, start working with it:
How to add MACD to MetaTrader 5?
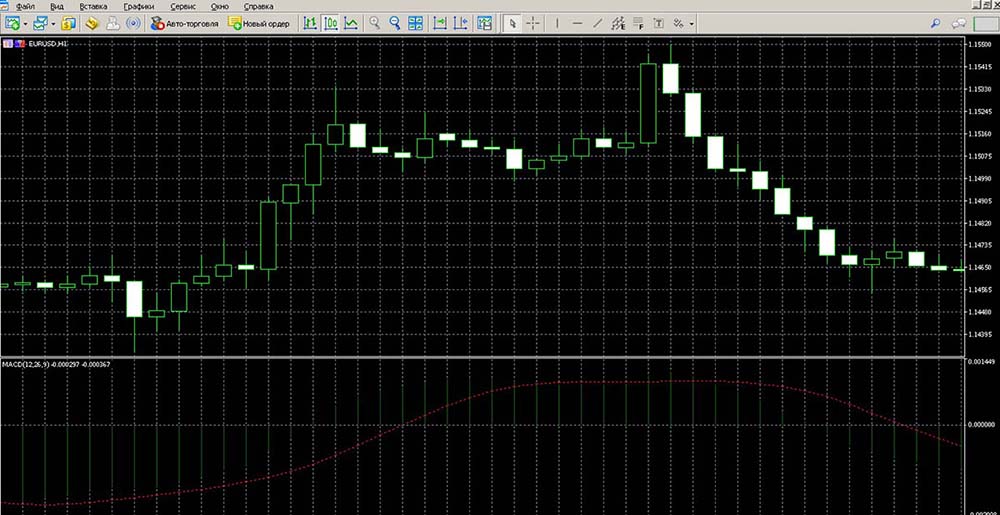
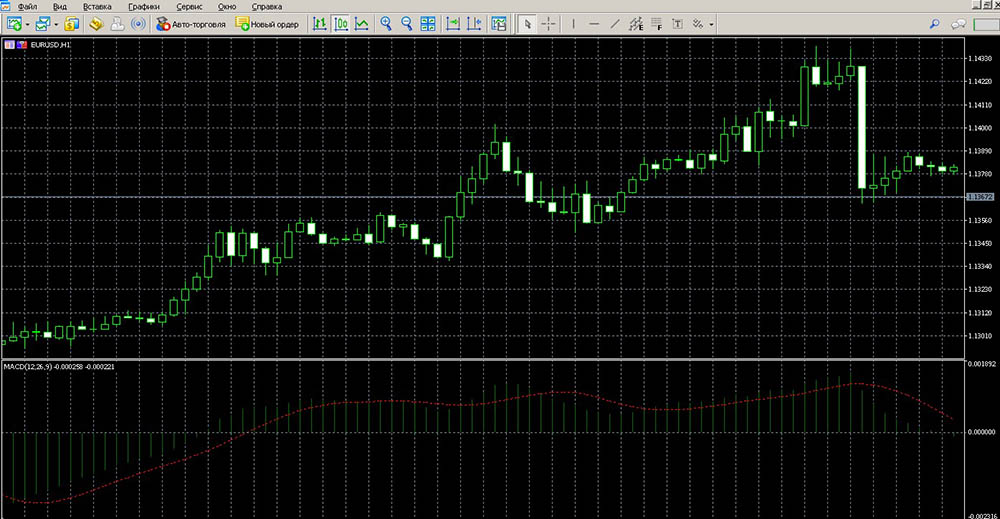
As for the updated version of the legendary trading software, everything is the same as when working with MT4. Having chosen the MACD in the list of oscillating tools, all that remains is to make its settings. Then, by pressing the “OK” button you can work with its information:
How to add MACD to the broker’s terminal?
- FiNMAX
As one of the leading brokerage firms, Finmax offers the client several opportunities to analyze market sentiment. Here, among others, there are oscillators, such as MACD. One or another instrument can be chosen among those available right in the main trading area. It is enough only to click on it:
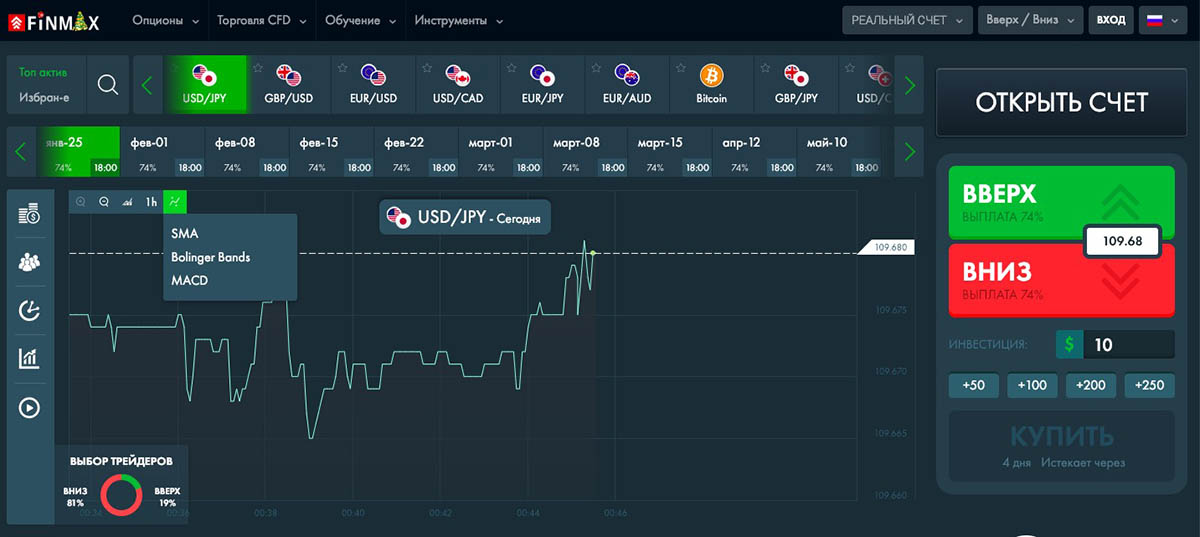
Since the terminal is not possible to make adjustments to the tools, which is inconvenient because it limits the players in their capabilities, then, after adding a tool to the chart, you can immediately start working:
In the trading space of this brokerage organization there is also the tool we describe. All indicators and oscillators are available in the bottom toolbar:
To select the one you want to work with, you only need to click on it:
This will open its settings window:
To add it to the graph, just use the “Build” button:
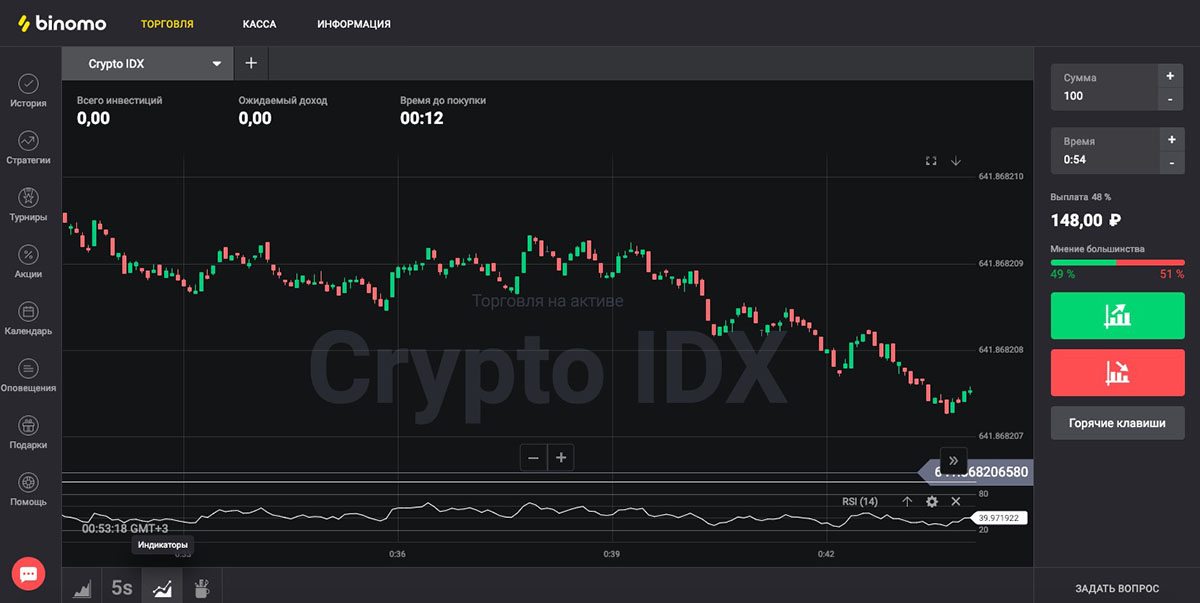
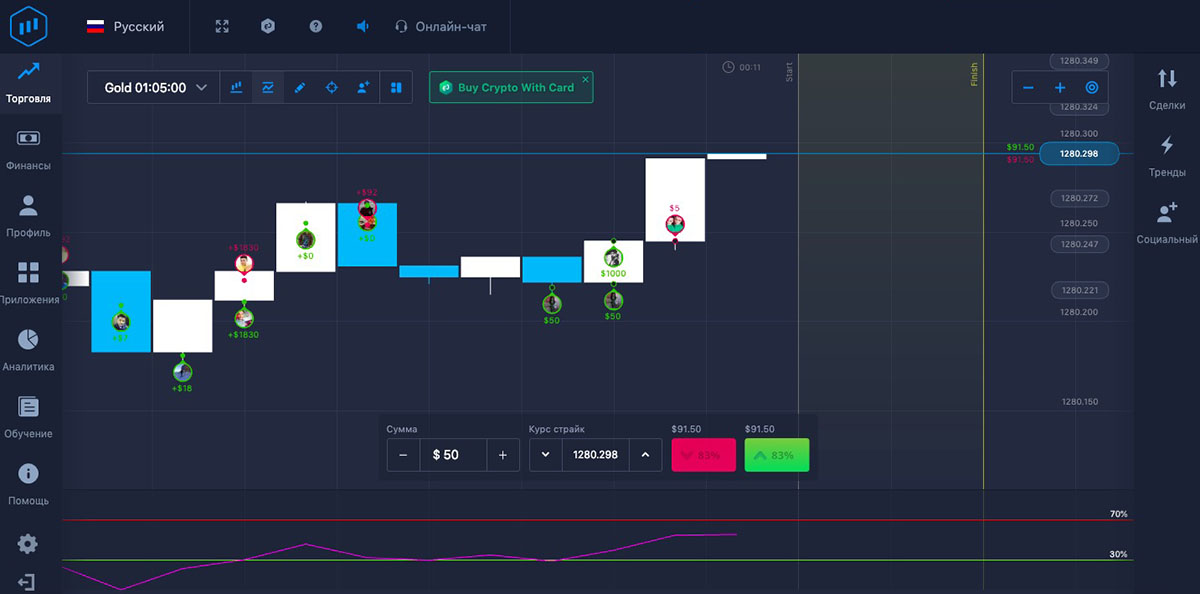
The convenient platform of this brokerage company also offers a set of tools to analyze the dynamics of market sentiment. Oscillators are located in the main workspace of the program:
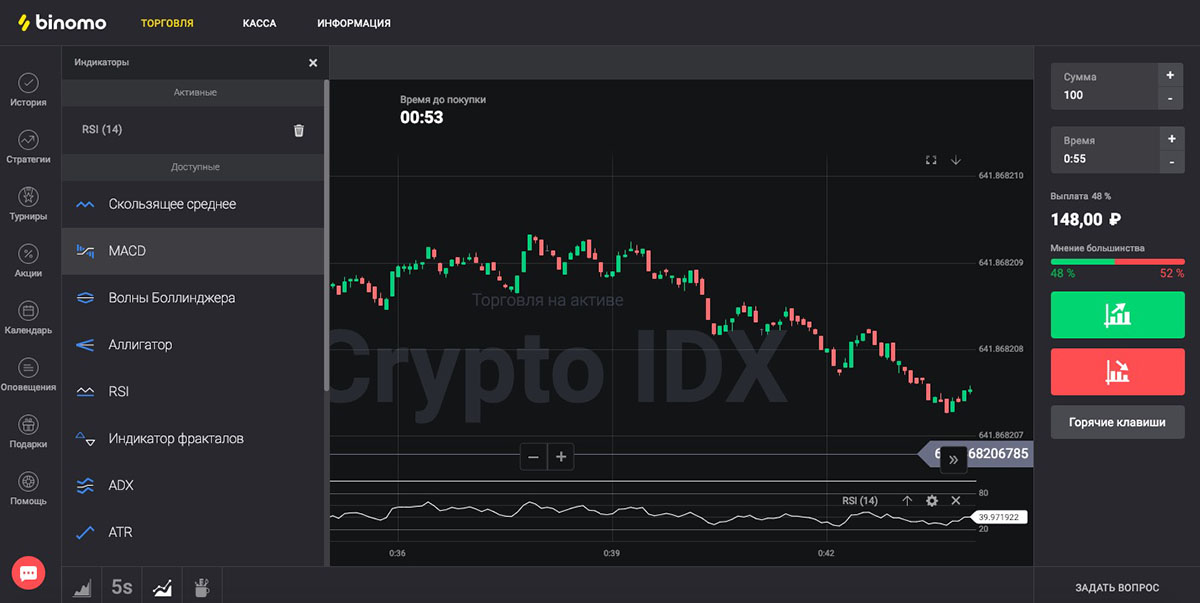
By clicking on the “Indicators” button, players can see a list of available tools and choose something to work with:
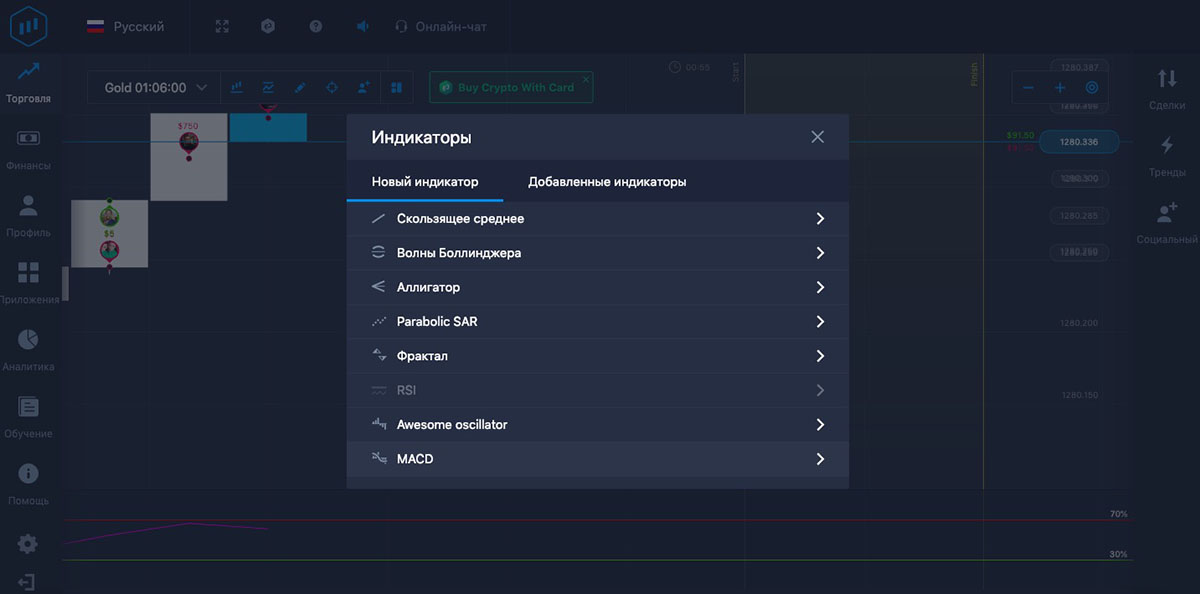
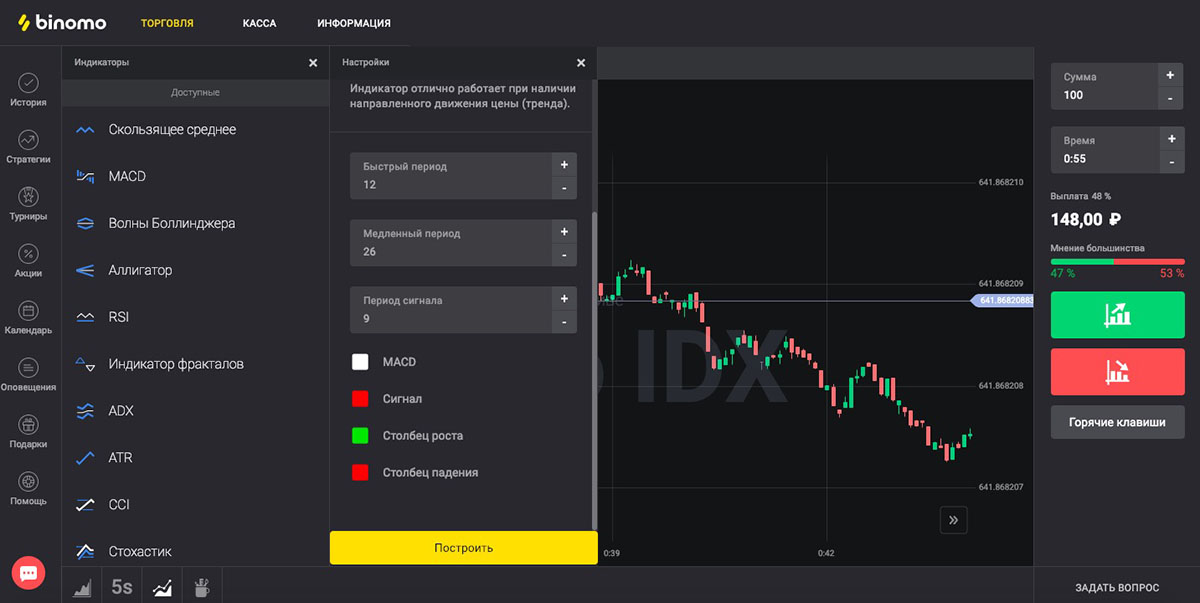
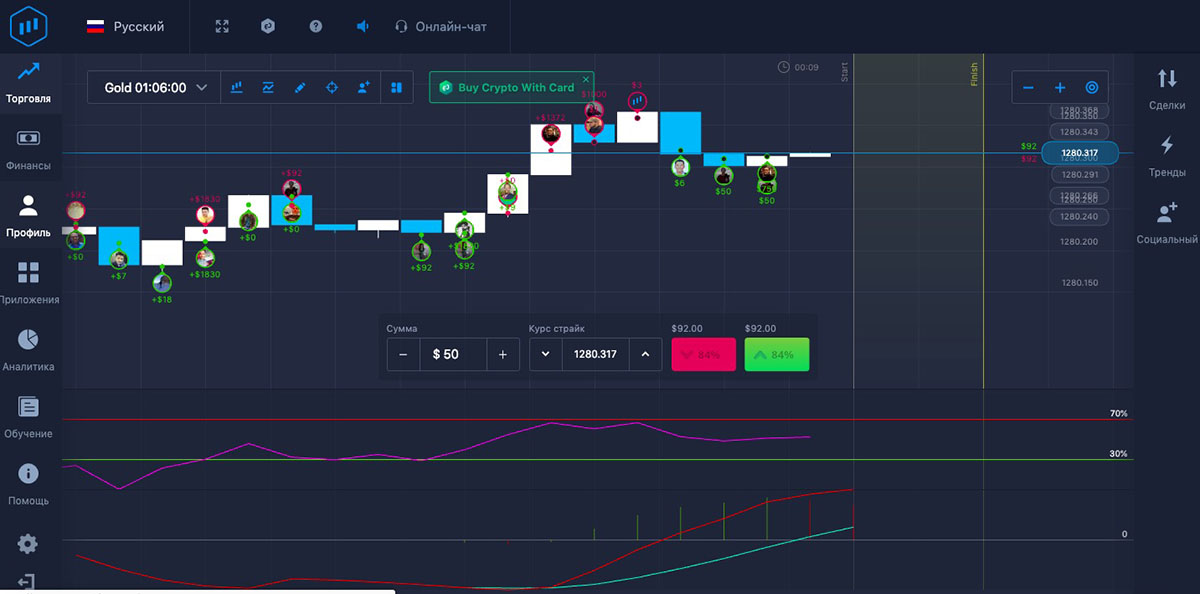
Next, you can make adjustments to the tool and, by pressing the “Apply” button, easily add it to the graphic and continue working in the program:
How to install the oscillator in the terminal?
As you know, the more convenient and functional terminalThe more options are available to the player, the more options there are for working with asset analysis and making money. If such programs have a lot of options, if they are easy to learn and do not freeze while working, they are interesting to traders. Among the options that are convenient for them is the ability to add new oscillators to such a program. What is it for? Thanks to this option, any tools can be loaded into the platform and any strategiesThereby increase the efficiency of their work, use different data about the signals. However, this option is not available in every platform, which does not prevent players from having accounts at brokers and those standard platforms that offer them much more opportunities. This is, for example, MT4 (or MT5), in which you can freely install any tools, including robots and advisors.
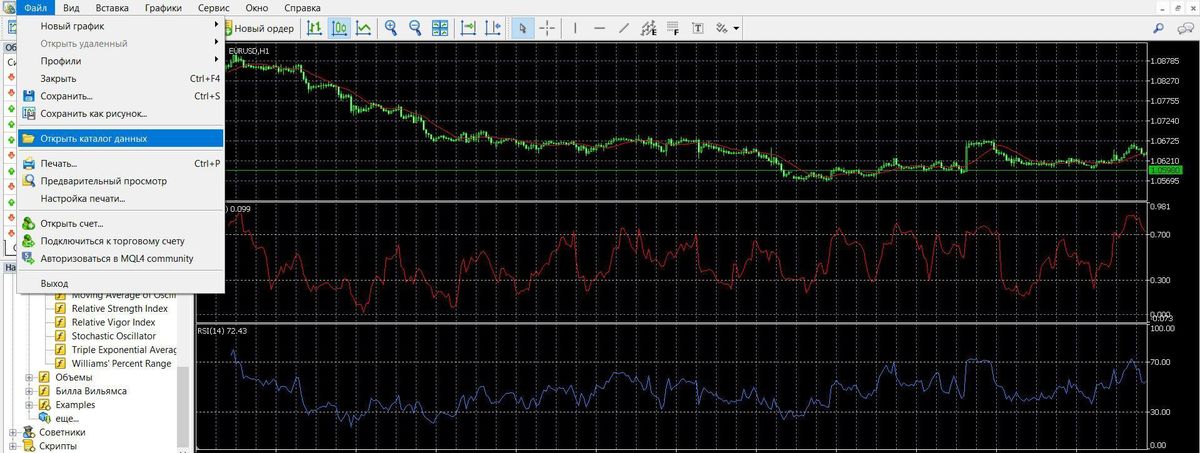
Of course MACD is a standard tool, but it may be that it is not present in the program, so it is worth knowing how to add it to the platform. First of all, you should find its files on the Internet. Now you can start working in the program itself by going to its data directory:
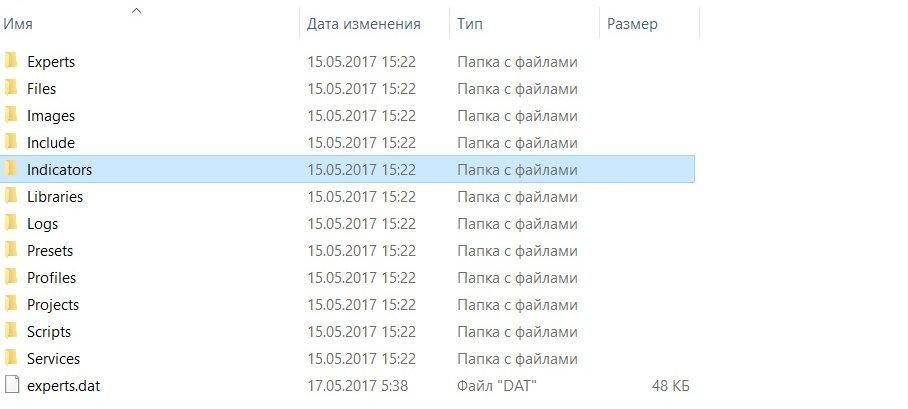
Here you need to go through: “MQL4” – “Indicators”:
This is where you can see a list of files previously installed by the player in the program:
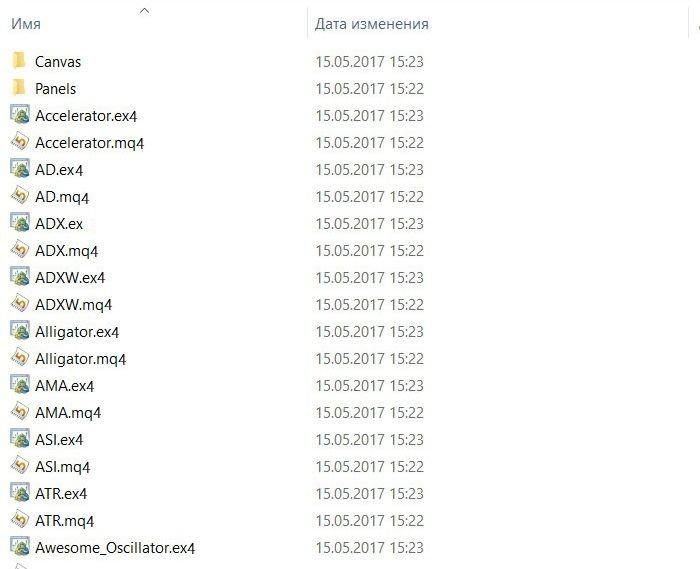
You can also add the files of the tool we describe here. Now it is in the program, it only remains to restart the terminal (close and open it again) and check if it appears in the user tools folder:
MACD trading signals
Intersections of the signal muving:
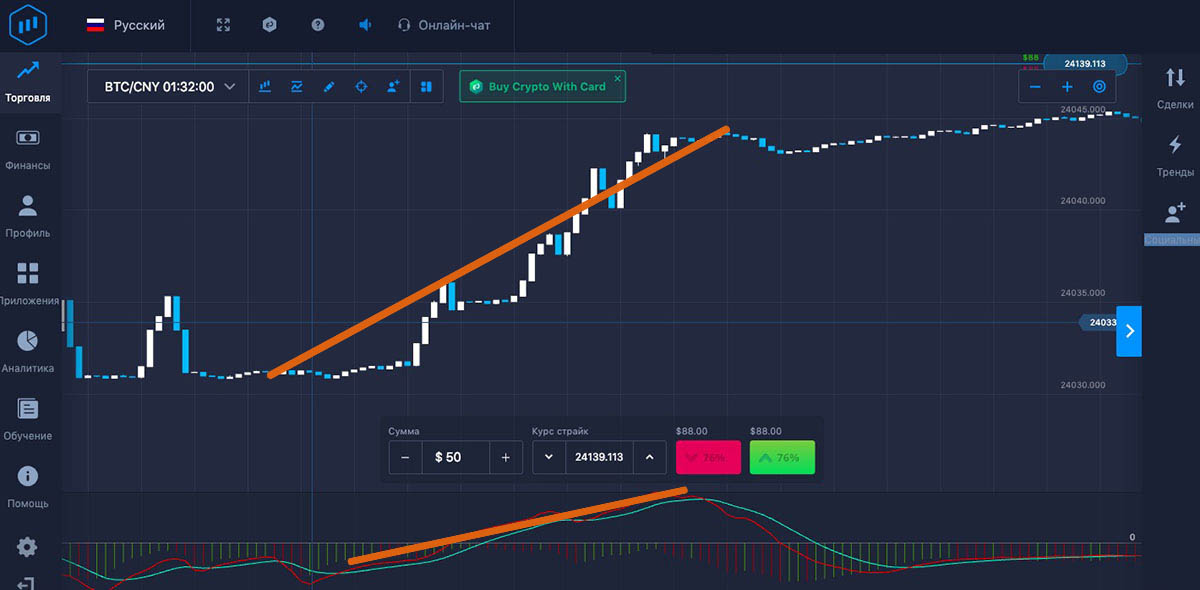
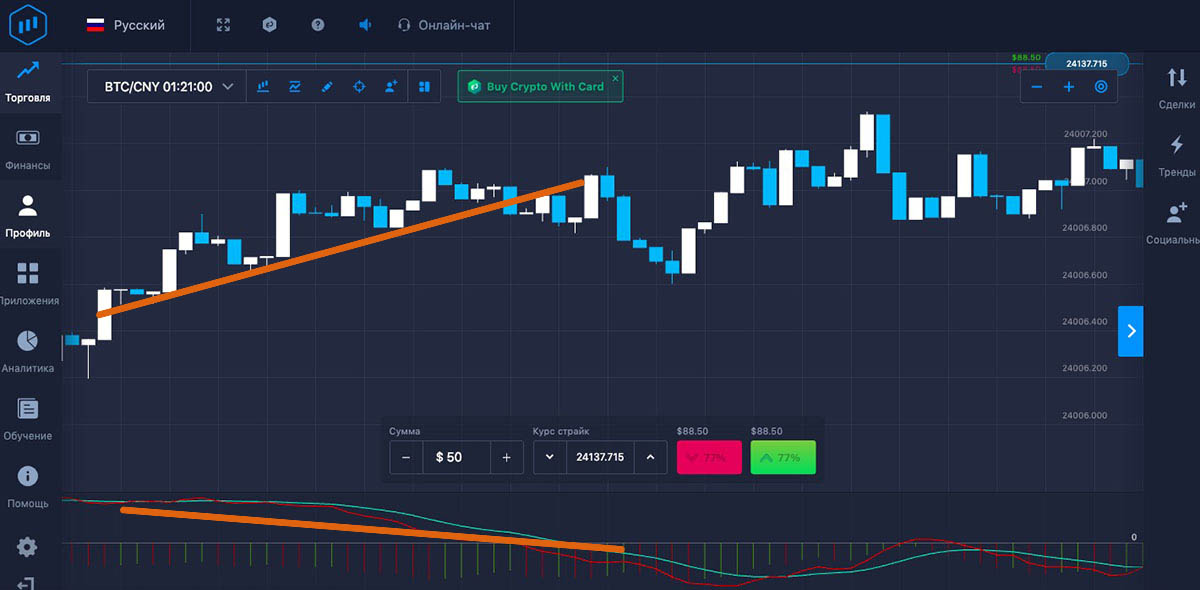
- When the MACD, crossing this line, is pointing upwards from below, it is preferable to open a KOLL bet,
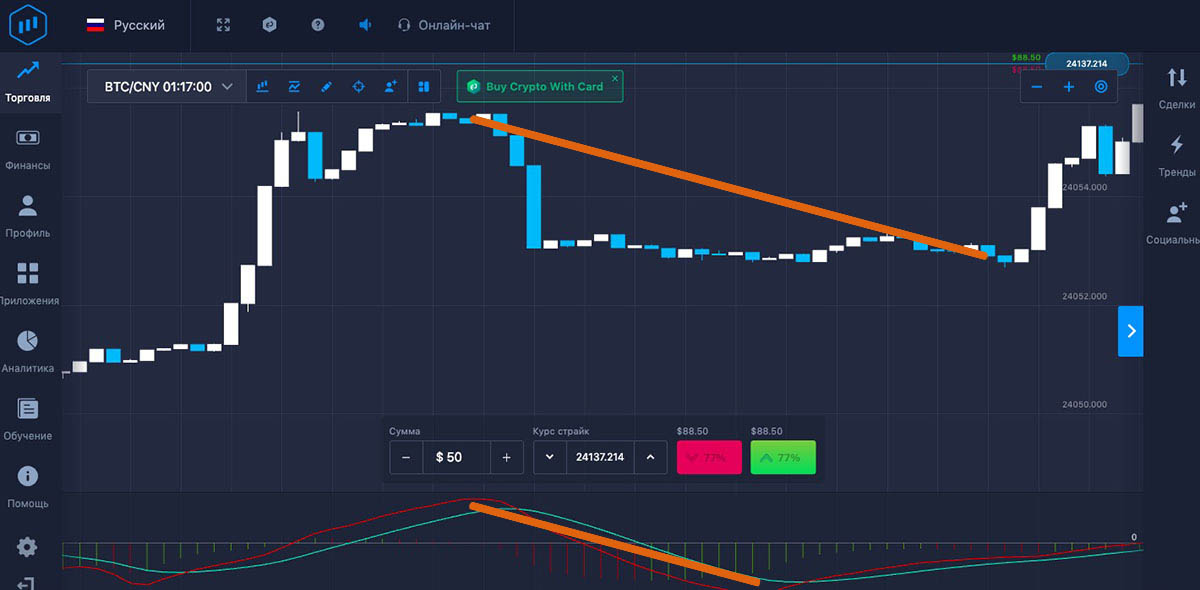
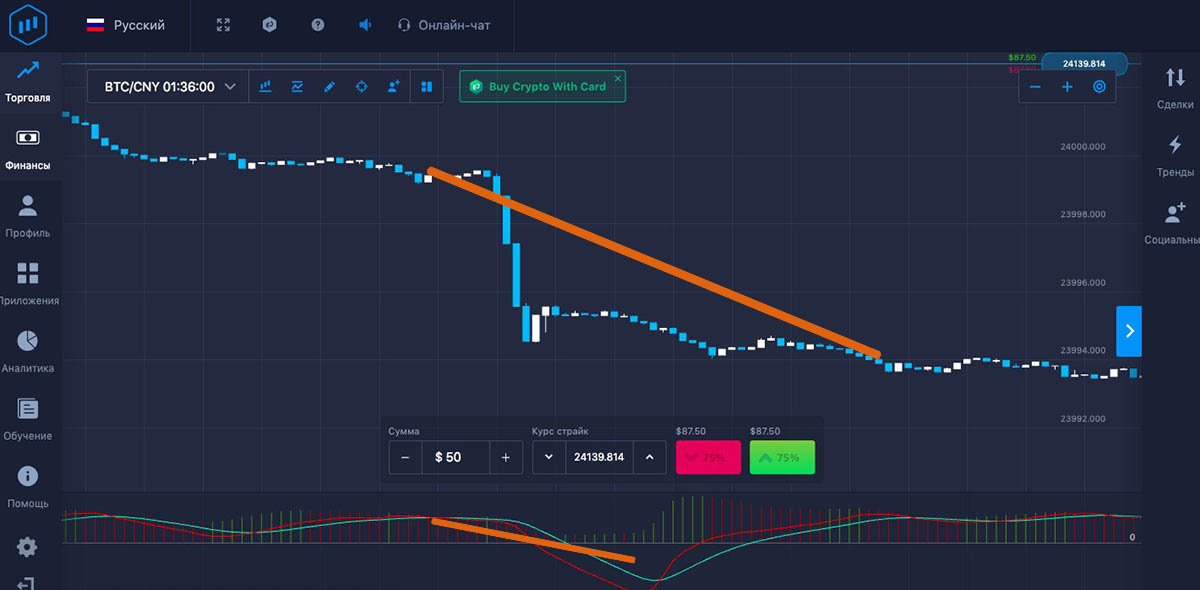
- When it, crossing it, is directed from top to bottom, it is preferable to open PUT bets.
Histogram Signals:
- If it is rising (that is, its previous column is lower than the next column) regardless of where it is located (below or above zero), bullish sentiment dominates, it is recommended to work with bets on the rise.
- If, on the contrary, it is falling (that is, its previous column is higher than the next one), bearish sentiment dominates, it is advisable to place downside bets.
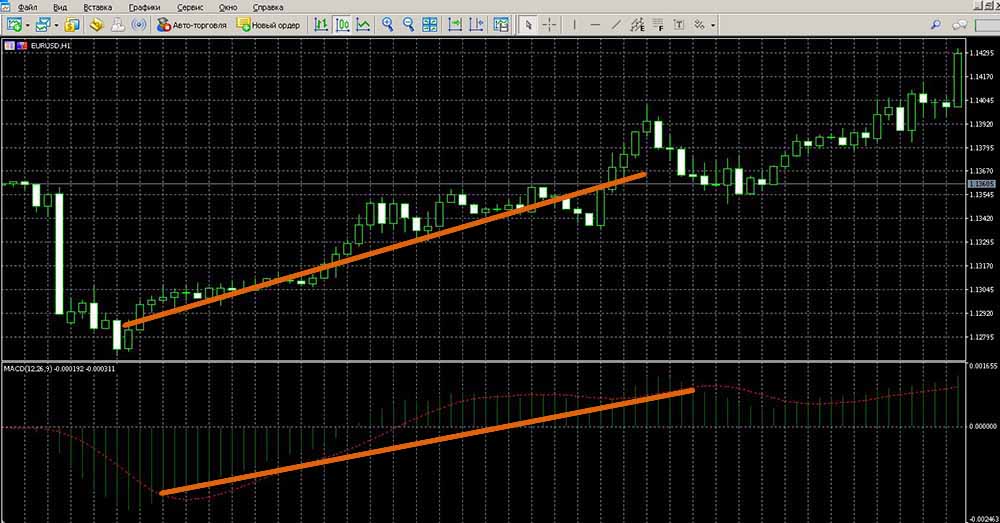
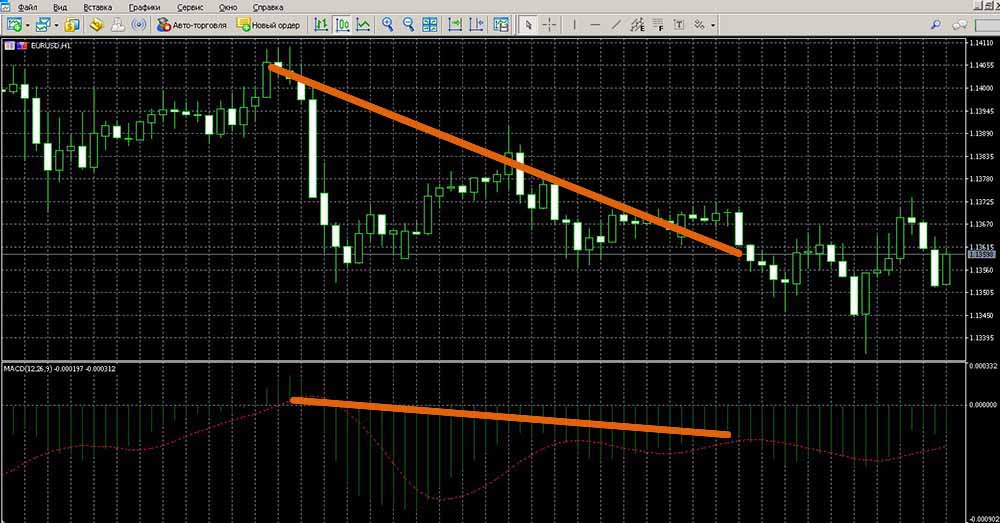
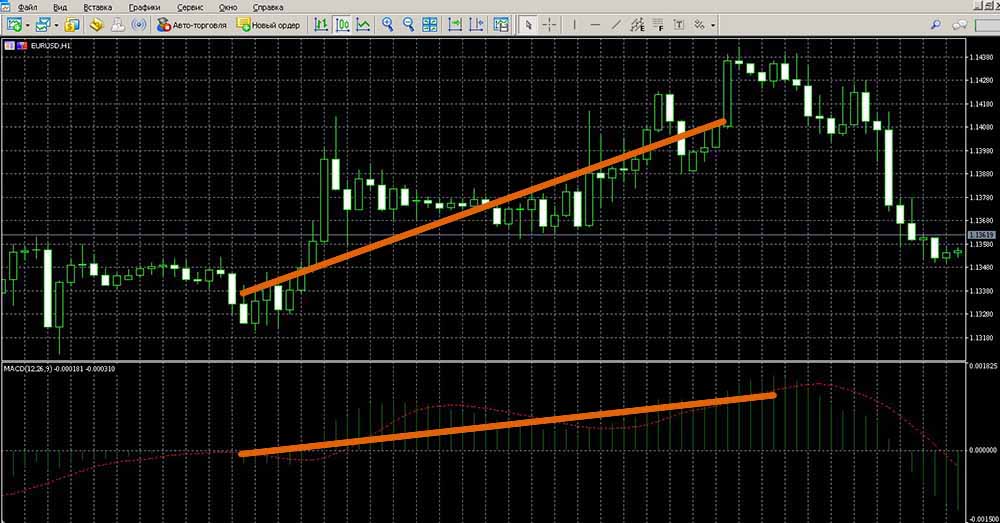
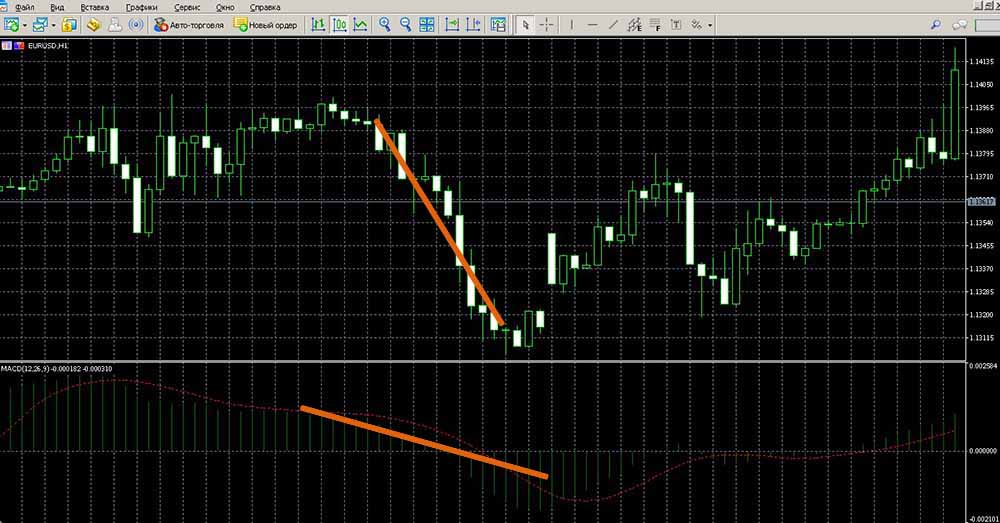
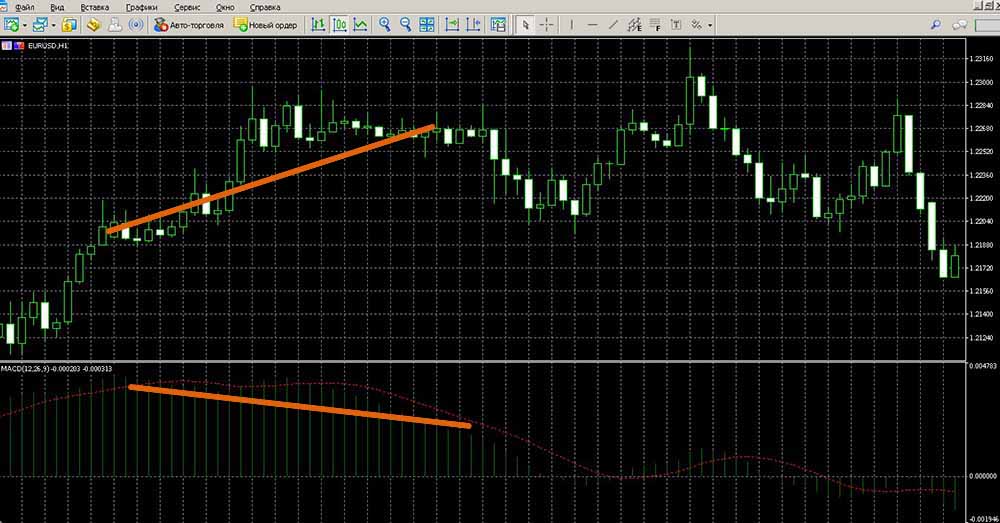
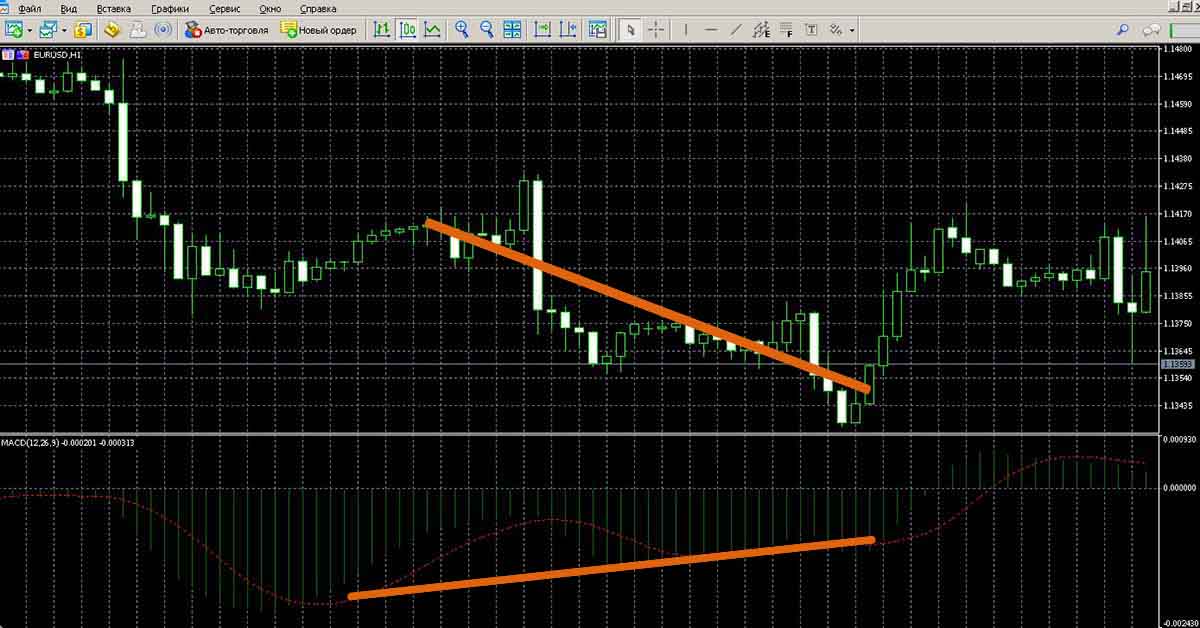
Discrepancy:
- Divergence (bullish divergence) appears when price highs are not confirmed by MACD information. It’s worth making a Koll trade.
- Convergence (bearish convergence) appears when price lows are not confirmed by the MACD. It is worthwhile to execute PUT contracts.
MACD signals in Metatrader 5
- Intersections of the signal muving:
Implementation of Upward Deals:
Implementing DOWN deals:
- Histogram signals
Rising Deals:
Down deals:
- Discrepancies
Contracts with value UP:
Contracts with value DOWN:
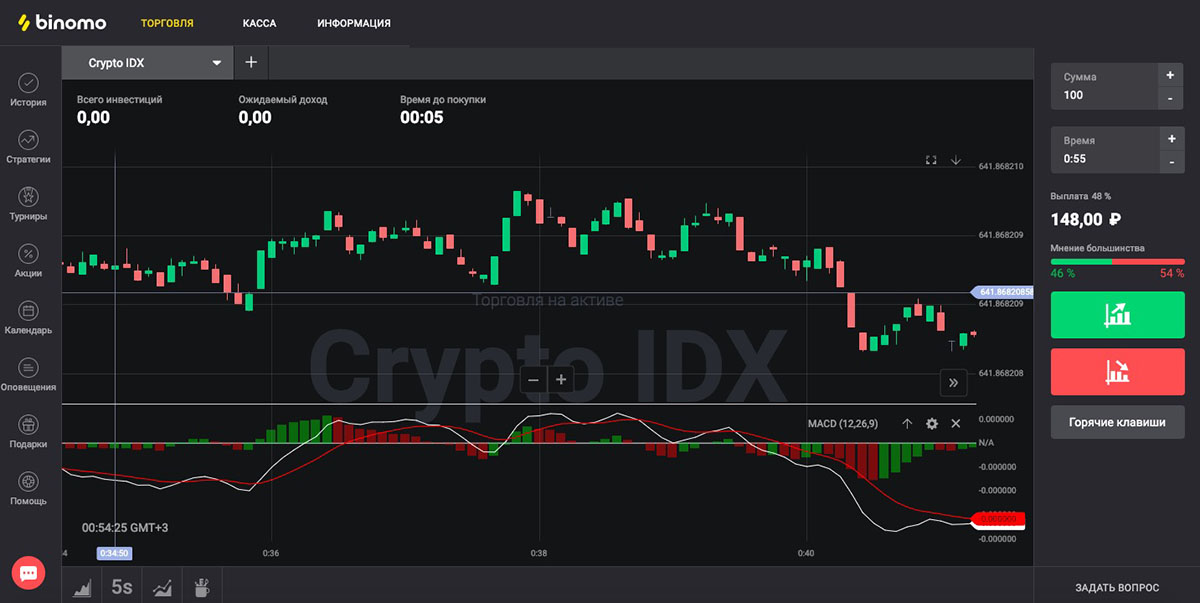
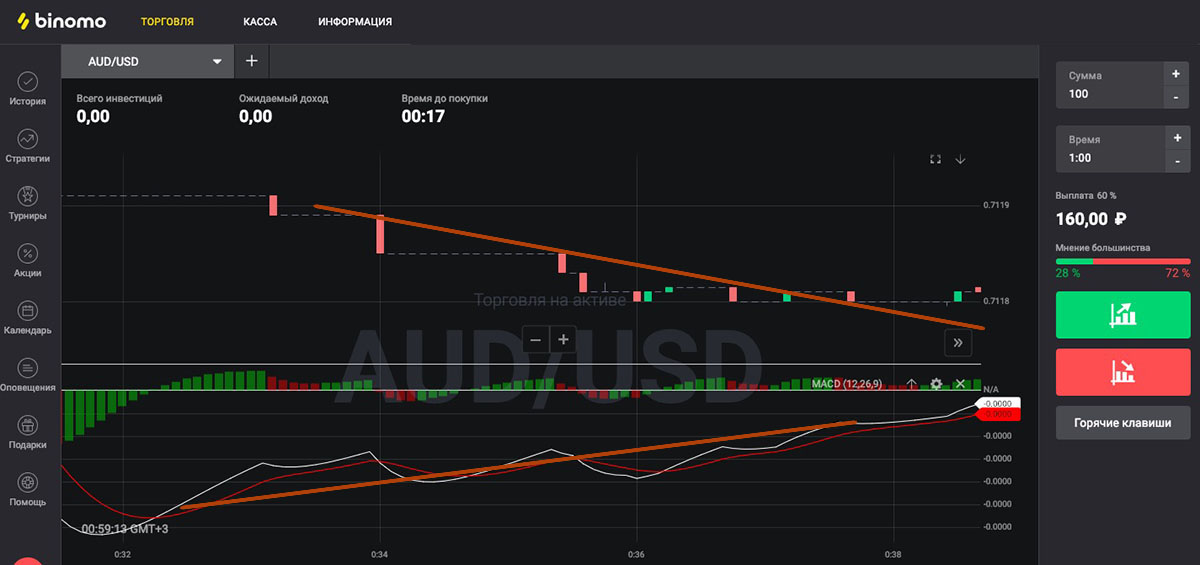
MACD signals in Binomo
- Intersections of the signal muving:
Implementation of KOLL deals:
Implementation of PUT transactions:
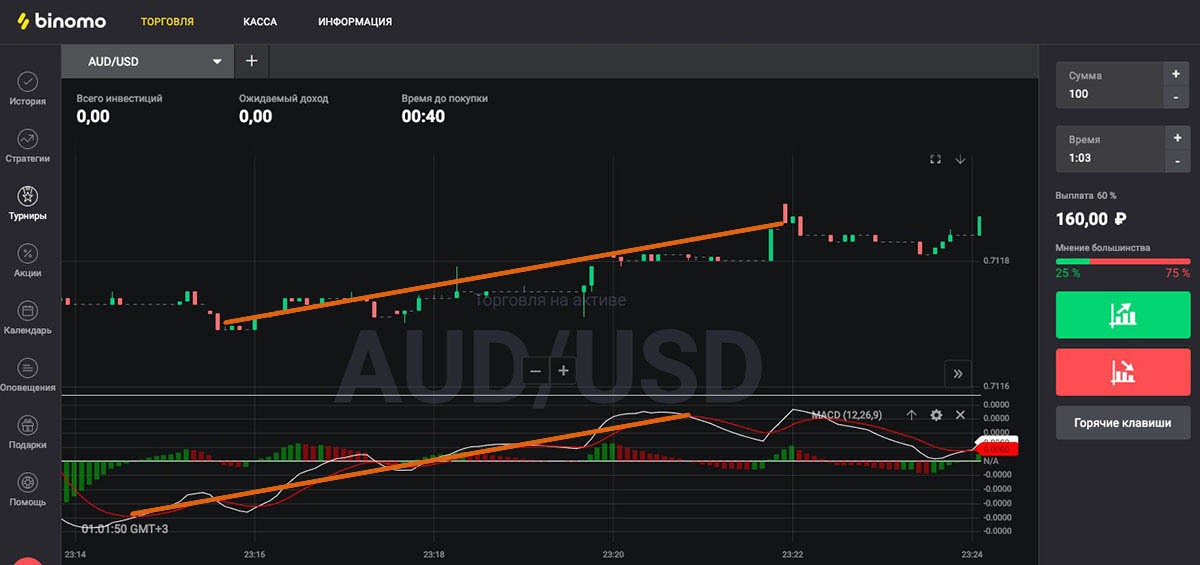
- Histogram signals
Rising Deals:
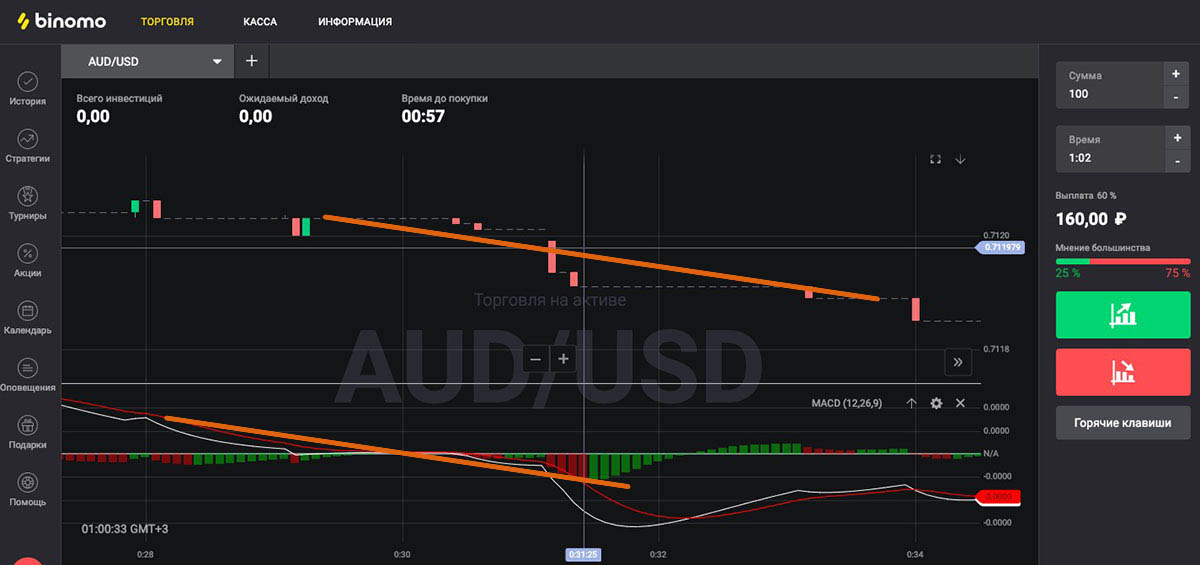
Down deals:
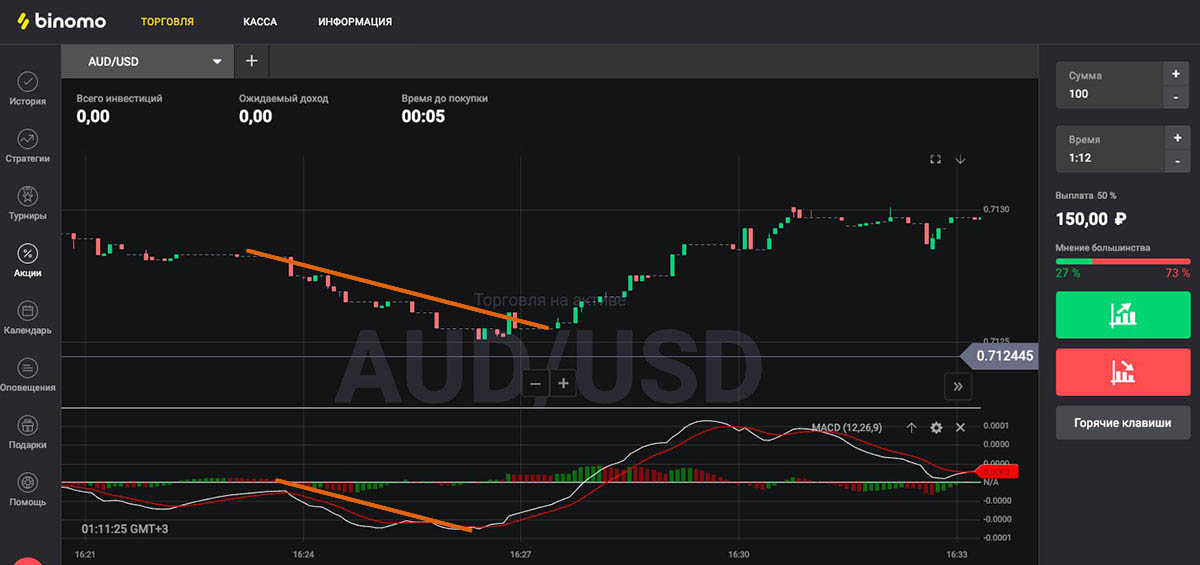
- Discrepancies
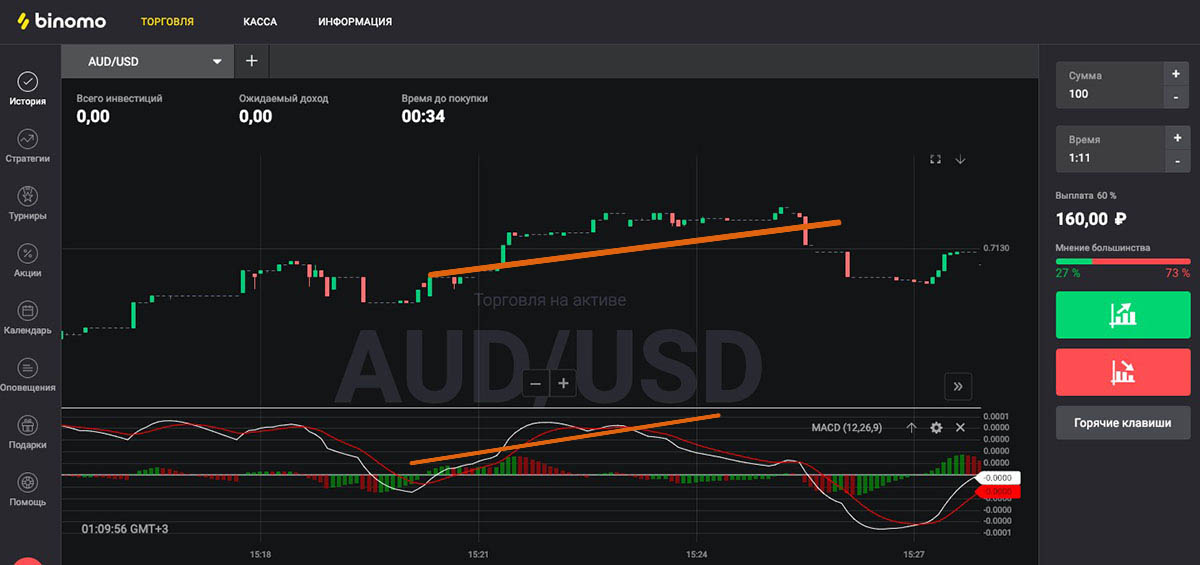
Contracts with value UP:
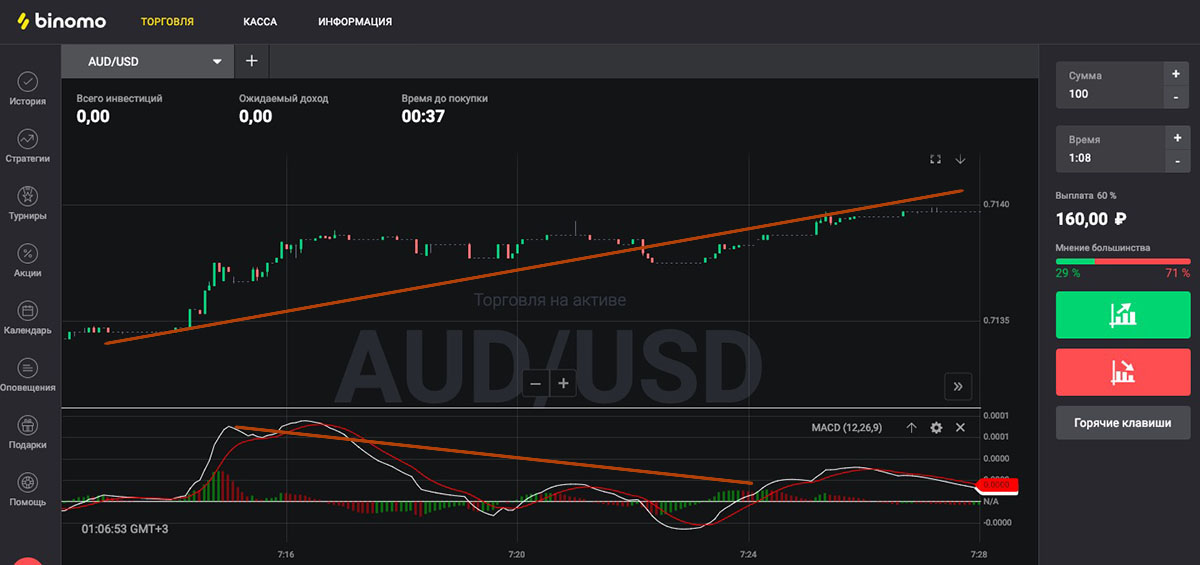
Contracts with value DOWN:
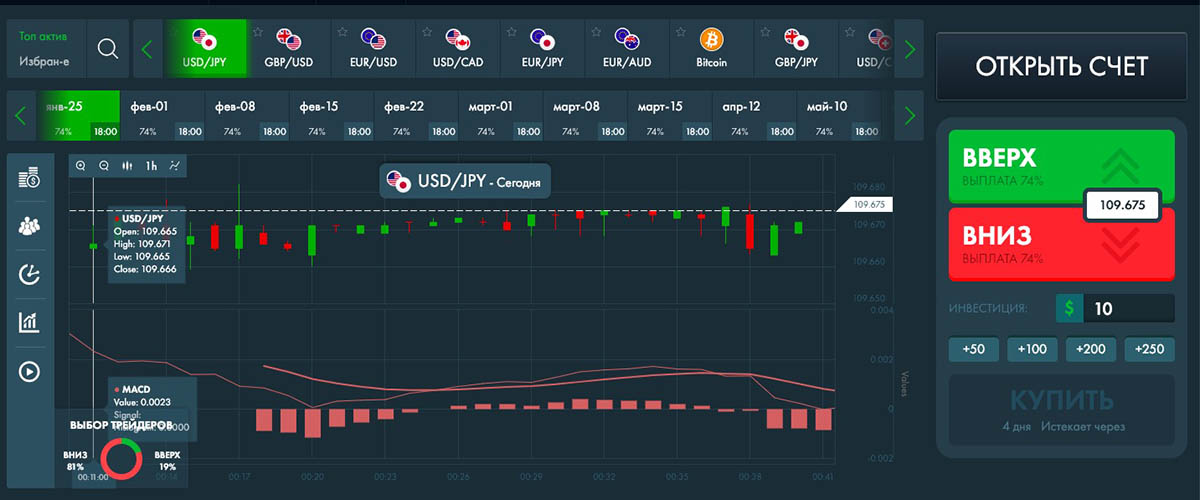
MACD Signals at Expertoption
- Intersections of the signal muving
Implementation of Upward Deals:
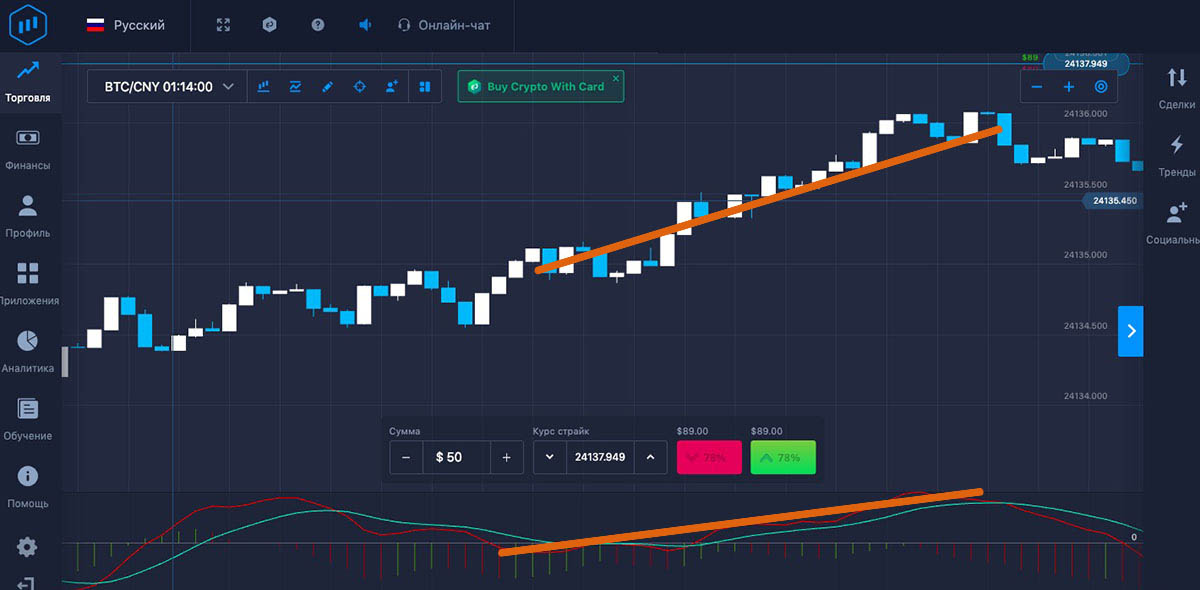
Implementation of PUT transactions:
- Histogram signals
Rising Deals:
Down deals:
- Discrepancies
Contracts with value UP:
Contracts with the value of PUT:
Strategies with MACD
- “Multiple.”
One of the trading techniques based on MACD readings, including data from complex instruments that include a MACD. Here we will talk about one such system based on MACD MTF signals, which in English means “MACD with several time intervals”. Its working principle is the same as that of MACD, but the difference is that the time parameters are taken into account in calculations here. The advantage of such a modification of the classic tool is that now you can easily find the stable market moods, which increases the quality of signals, although they become less. Working with the strategy is simple: the registration of bets on the rise occurs when crossing the yellow line from below, the point must be green; the registration of bets on the decline occurs when crossing the yellow line from above, the point must be red.
- MACD and fast RSI
As most traders know, the use of several tools at the same time will increase the accuracy of data on the dynamics of assets, filter out false indicators and market noise. This methodology is based on MACD and RSIThe MACD is able to determine the strength of the current market sentiment, as well as the most profitable entry points. MACD is able to determine the strength of the current market sentiment, as well as the most profitable points to enter the market. RSI also determines the prevailing market sentiment, as well as those zones when they change to the opposite trend.
For registration of contracts on increase it is necessary to identify the following complex of indications of tools on the chart: RSI should cross from below a mark 30 and begins to show increasing moods, the white line of MACD thus gradually turns, at this time the price shows closing of the increasing candle of green color. For registration of the contracts on decrease it is necessary to identify the following complex of indications of tools on the schedule: RSI should cross a mark 70 from below and starts to show the decreasing mood, the white MACD line thus gradually turns around, at this time the price shows the closing of the decreasing candle of red color.
- “Turbo MACD”
This trading tactic is focused on the Binomo platform, which features a unique toolkit and a large set of assets to work with, thus guaranteeing the effectiveness of the trade. This system is based on a single oscillator, the MACD, which is used in three variations and generates accurate data on market sentiment and immediately acts as their confirmation. The tactic makes it possible to obtain approximately 90% profitable trades.
To place a bet in the direction of increasing asset sentiment, the following data should be identified on the chart: when the long and standard MACD lines will show a crossing in the upward direction; at the same time, the short MACD moving average will cross the zero mark upward. To place a bet in the direction of falling asset sentiment, the following data should be identified on the chart: when the long and standard MACD lines show a downward crossover; at that the short MACD moving average crosses the zero mark downward.
- “MACD correction”
One of the trading tactics popular among traders because of its simple operation and generation of accurate data for entering a position. Its peculiarity is that it uses the data of moving averages and MACD – highly effective, but simple and clear analyzers, familiar to all players, which allow you to easily catch the fluctuations in price, which are usually not noticed. In this case, the MA serves as a trend direction indicator and the MACD shows the price reversals that will allow a player to gain some profit. The efficiency of this tactic is about 150% of profit to the account.
In order to place a bet on the rise, it is necessary to wait for the formation of the following indicators of the instruments on the chart: MA shows the downward mood, moving downward; the price falls under the MA, at the same time MACD, having fallen under the axis muving, crosses here in the ascending direction; at the same time its histogram is built above the zero axis. To place a bet on the decline it is necessary to wait for the formation of the following indicators on the chart of the instruments: MA shows ascending sentiment, moving upward; the price rises above the MA, at the same time MACD, being above the axial muving, crosses here in descending direction; at the same time its histogram is built below the zero axis.
The peculiarity of this trading tactic is that it uses familiar to the player tools, acts as an identifier of data to enter the market and immediately to filter them. All this allows to get confident trading with such signals, which will bring profit to the player, which will be effective and allow him to increase the size of his account. The advantage of this technique is that the risks are greatly reduced. As for its constituent instruments, there are 2 MA indicators (in the WMA and EMA) and MACD, which just acts as a filter for the data generated by the slides.
To enter a position with an Up option, expect the following combination of methodology data on the chart: WMA should cross the EMA moving up; MACD is above the 0 level and heading upwards. To enter the position with the option DOWN it is necessary to expect the following combination of indicators: WMA must cross going downwards EMA; MACD is below 0 and going downwards.