Gator Oscillator
Contents
Description of the Gator Oscillator
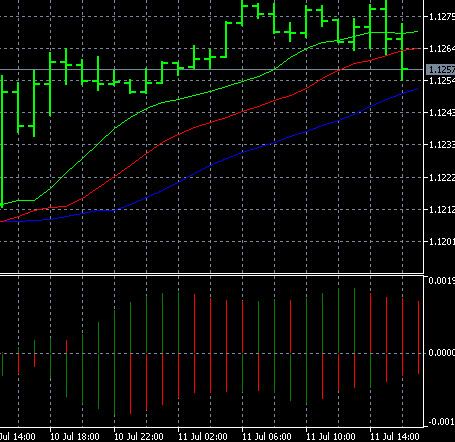
The Gator Oscillator (Fig. 1) was developed by the famous trading theorist and practitioner Bill Williams:
Image. 1
This one forex indicator refers to the type of trend indicating the direction and strength of the main market trend. It allows you to determine the moments of the beginning, reversal, development and decay of the trend at forex trading. In this case, this oscillator is a variation of the most famous one, Alligator, and is used in strategies most often in conjunction with it.
The Alligator indicator (Fig. 2) is a combination of three moving averages with a shift to the future along the trend line. According to Williams’ idea, when the lines are placed at a great distance from each other, the strength of the trend is great, in the author’s concept it means that “Alligator is hungry”. When the moving averages are crossed, “Alligator is full”, the market is in a flat.
Image. 2
The problem is that the distance between slips is difficult to uniquely identify, which is why Williams created the auxiliary forex oscillator – Gator Oscillator. It is a two-color histogram in which the information of the Alligator lines is indicated by color, location relative to the zero mark, dynamics and size of the histogram bars. This tool makes the Alligator more understandable for traders and allows you to develop and organize forex strategies trading, assessing the strength of the trend, finding divergences (The whole truth about forex).
The Gator Oscillator (Fig. 3) is a histogram, the bars of which are placed above or below the zero line and are colored according to the trend dynamics:
Image. 3
The histogram, which is placed above the zero line, shows the absolute value of the distance between the “jaw” and the “teeth” of the Alligator indicator. Recall that the “Jaw” is a 13-period smoothed moving average, shifted forward by 8 bars, it is a blue line. The “teeth” is an 8-period smoothed moving average, shifted forward by 5 bars, usually a red line.
The histogram, which is located below zero, shows the absolute value of the distance between the “teeth” of the Alligator and the “lips” of the Alligator. The lips are a 5-period moving average, shifted forward by 3 bars. This line is green in color. If the current value of the oscillator is lower than the previous one, histogram bars are colored red. If the current value of the histogram is higher than the previous one, the bars are colored green.
The maximums of the Gator Oscillator indicator show the maximum divergence between the smoothed moving averages, and the minimums of the indicator show the maximum negative divergence, both of which indicate a strong trend. Placing the Gator Oscillator near zero indicates a weak trend or no trend.
Log into your broker’s terminal, add the Oscillator Gator to the chart and see what comes out
| Broker | Bonuses | Open an account |
|---|---|---|
|
1
|
50 %
Bonus on deposit from $100 USD – promo code WELCOME50
|
Start |
|
2
|
From 25 To 60 %
Deposit increase for the first deposit
|
Start |
|
3
|
Cashback
Refunds of commissions, spreads and other costs
|
Start |
|
4
|
100 USD
Loyalty program remuneration
|
Start |
|
5
|
20 %
Bonus and cashback by promo code revieweek23
|
Start |
Oscillator Gator in the MetaTrader 5 platform
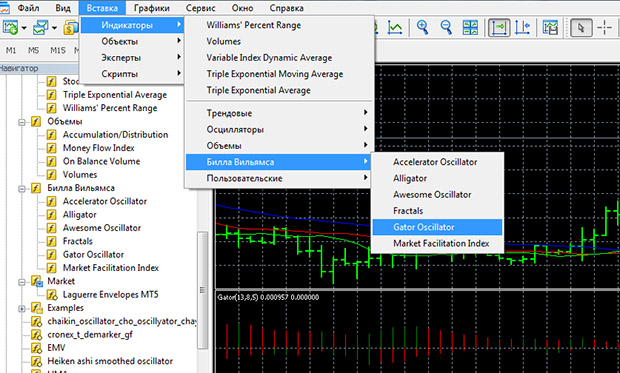
The Gator indicator is included in the list of standard indicators of trading platforms, in particular Metatrader 4 and 5. You can add it to the MT5 chart (Figure 4) through the “Insert” section, subsection “Indicators”:
Image. 4
The oscillator works as an additional indicator for the “Alligator”, its parameters can be changed, but it is not recommended to do this until you fully understand the principles of the Williams indicators.
Gator Oscillator signals
The Gator Oscillator does not generate independent Forex Signals It is not used separately, but only as an auxiliary tool for the Alligator. In fact, it gives signals similar to the Alligator itself, but expressed in the form of a histogram, which is visually more clear and allows you to open transactions more accurately. At the same time, you should give preference to the Alligator’s signals when opening positions.
It is believed that it is better to open a position when the bars of the chart are growing, for example, a strongly elongated green bar is a quality signal to enter the market – it confirms the strength of the trend. If the bars are colored above and below the nought line, it means that the “Alligator is waking up” (Fig. 5), or, simply put, a new trend is forming:
Image. 5
An active trend development is indicated by green bars on both sides of the zero line. The formation of a flat movement is indicated by the appearance of red bars on both sides. If different colored bars appear as the trend develops, it indicates that the trend is slowing down. It is believed that the Gator Oscillator is best used on medium and long timeframes.
Trading strategies based on the Oscillator Gator
The main strategy of using the Gator oscillator is together with the Alligator indicator and without additional instruments. Buy positions are opened when prices are placed above the Alligator lines, the Gator bars are colored green both above and below zero. Positions should be closed when the price is below the red Alligator line. Sell positions are placed below the Alligator lines at similar Gator readings, and are closed when price closes above the red line.
By the way, some traders use the Gator as an independent indicator in its correlation with the price chart. For example, it is believed that if the sequence of Gator’s vertices forms a descending triangle in a downtrend, it can be a signal of price increase. Conversely, if the sequence of Gator vertexes forms a divergent triangle, it can be a signal of price decrease.
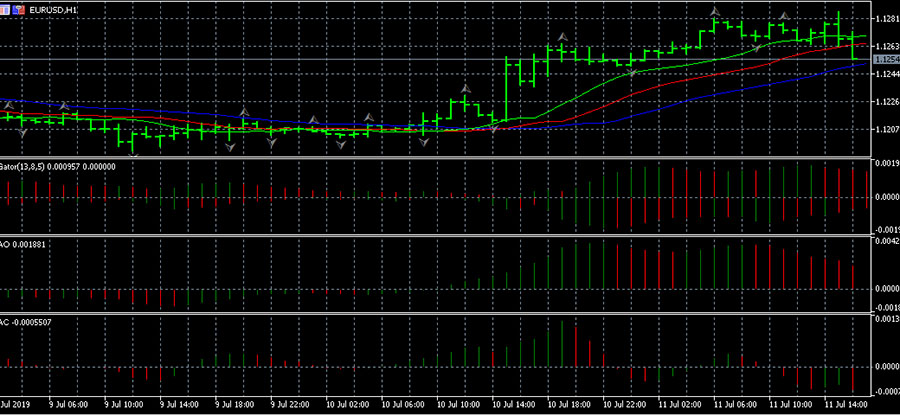
Gator is used in multi-indicator strategies (Fig. 6) as an oscillator that confirms Alligator signals and works synchronously with other Williams indicators. One such strategy is the trading system with the Alligator indicator, By Fractals (Fractals), “The Miracle Oscillator.” (Awesome Oscillator) and the Acceleration/Deceleration Oscillator. The strategy is implemented on any currency pair on bar chart, on the timeframe of H1 and above. Alligator oscillator is additionally installed on the chart.
Image. 6
The first signal of the strategy will be a signal from the Fractals. If a fractal is formed, which is located above the red alligator line (“teeth” according to Williams’ terminology), it is a signal to buy and a pending buy order can already be placed. After the order has been triggered and executed, the signals shown by the “Miraculous Oscillator” are analyzed.
A few words about the Awesome Oscillator. This is an analogue of MACDbut its indicators are not based on closing prices, but on Median Price and it is the difference between the 5-period ordinary moving average and the 34-period ordinary moving average – both are calculated from the median. Thus, unlike the MACD, the Miracle Oscillator has fixed moving lengths and has no signal line.
The Awesome Oscillator signal to buy is the placement of the oscillator above the zero line, while on the histogram the first column will be of any color, the second column is red and is below the first, the third column is colored green and is above the second. This configuration is called the “Saucer” configuration. This is what you need to look for in order to implement the strategy. If “Saucer” is marked, the next pending order is set. Then the signals of the indicator Acceleration/Deceleration of the market are monitored.
The Williams acceleration/deceleration indicator measures the rate of price acceleration or deceleration, changing direction before the price changes on the chart, which allows you to work with the value prediction (forex analytics). AC indicators are calculated as the difference between the Awesome Oscillator indicator and the moving average of this indicator with a period of 5.
AC shows the following buy signals: when AC is placed above the zero line, two consecutive bars must have a greater value than the last bar of the downtrend on the chart. If the AC indicator is placed below zero, the buy signal will be a configuration of three consecutive bars of greater value than the last bar on the chart. Or it is already the second column, if the first two columns with higher values cross the zero line. Having marked these signals of the AC indicator, it is possible to place buy orders. One more pending order is placed when the green bars of two indicators Awesome Oscillator and Acceleration/Deceleration are formed simultaneously.
The strategy also notes the notional balance line, which is one of the concepts introduced by Williams. It means the moment when the price fluctuates around some conditional value, which would be on the market without updating. In general, the balance line coincides with the zero level of the “Miracle Oscillator”. When such a situation is formed, the strategy under consideration places an order 1-2 points above the maximum price of the bar, which was placed before the base bar.
Thus, in this strategy, there can be 5 buy positions open. Stop losses are of particular importance in this strategy, they need to be placed in each case when opening a position. In addition, positions are closed when the opposite signals for each indicator are received. The strategy exits when the trend develops and the bar closes under the red indicator line.
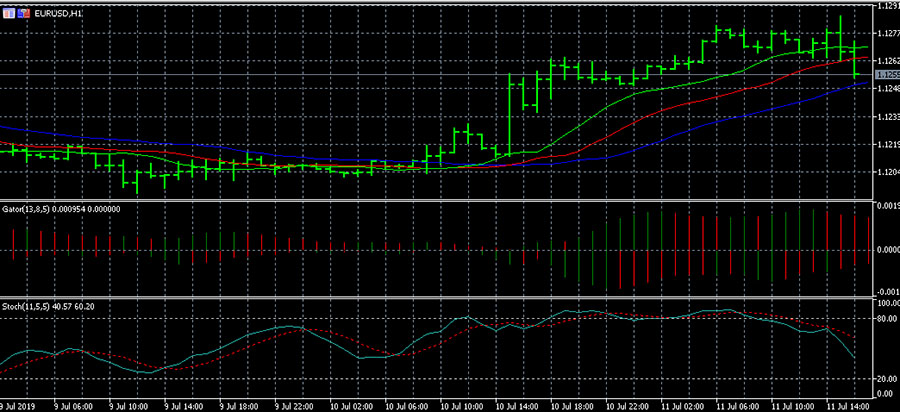
Another strategy uses the Alligator indicator, Gator to confirm its signals and Stochastic. The strategy is implemented on the time interval from M15 and above. Alligator indicator with parameters 13.8 and 5 bars is used for the strategy. Trading is carried out only in the direction of the trend. Stochastic here to a greater extent is necessary to filter false signals on the flat movement.
The signal to buy will be a crossing of the Alligator’s moving averages and their upward direction. Alligator signals must be confirmed by Gator signals. The signal to sell will be a crossing of the Alligator lines and their downward direction. Selling is performed only on the downtrend. Alligator signals will be confirmed by Gator signals. Generally speaking, strategies with Alligator and additional oscillator suggest trading in a pronounced trend.
Another strategy “Alligator+EMA“(Fig. 7), in which the Gator oscillator can be used to confirm Alligator line crossovers. Because in this strategy, the indicator lines are too tightly intertwined, it warns that positions should not be opened.
Image. 8
The signal to sell will be a consecutive downward EMA crossing of the Alligator lines; the signal to buy will be an upward EMA crossing of the Alligator lines.
Conclusions
The Gator Oscillator is one of Williams’ indicators. It is useful for traders who work with the Alligator indicator, because it allows them to better see and understand its signals.


