McClellan Oscillators
Market width
The McClellan oscillator was originally designed to determine the width stock market. Market breadth is the number of stocks rising in value relative to the number of stocks falling in value. Market breadth indicators are the tools of tehanalysis, which determine the direction of the trend, help to understand the mood of the market, whether it is rising, falling or neutral.
Such Forex Indicators assess the strength of the influence of buyers or sellers to increase or decrease the price and thus determine the strength of trend support and the probability of its continuation. Market breadth indicators can be very useful, providing information that cannot be obtained with other indicators. In addition to the McClellan Oscillator, market breadth is indicated by indicators such as the Rise/Decline Line, Balance Volume Indicator (OBV) and Arms Index (TRIN). These oscillators are also adapted for of forex trading, But not all of them are popular with traders.
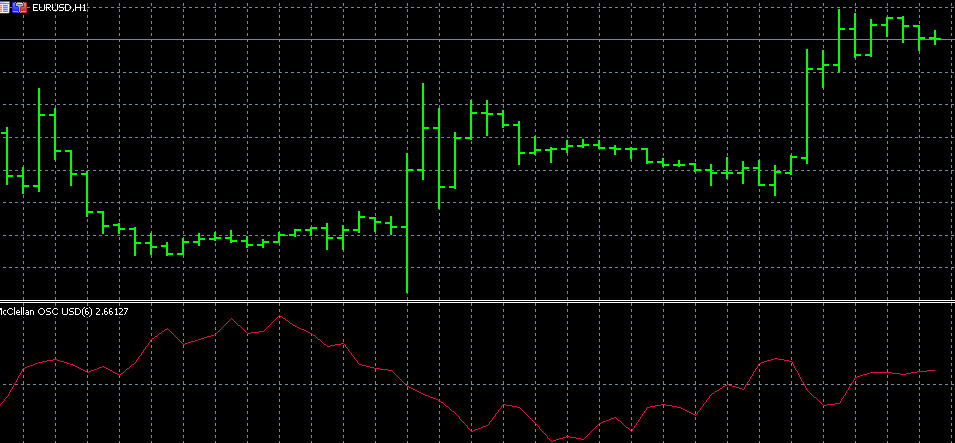
In 1969, Sherman and Marianne McClellan developed the McClellan Oscillator (Fig. 1) and the McClellan Summation Index and described them in the book “Profitable Patterns: The McClellan Oscillator and Summation Index”. There they also set forth the principles of treating the information of the instruments.
Image. 1
The McClellan Oscillator and the McClellan Index are some of the most popular instruments in the stock market, they are the primary instruments for the New York Stock Exchange (stock exchange). But it is impossible to call them frequently used in the forex market (The whole truth about forex). Most likely, this is because they do not have any unique features and traders work with more common indicators of similar action.
Log into your broker’s terminal, add McClellan oscillators to the chart and see what comes out
| Broker | Bonuses | Open an account |
|---|---|---|
|
1
|
50 %
Bonus on deposit from $100 USD – promo code WELCOME50
|
Start |
|
2
|
From 25 To 60 %
Deposit increase for the first deposit
|
Start |
|
3
|
Cashback
Refunds of commissions, spreads and other costs
|
Start |
|
4
|
100 USD
Loyalty program remuneration
|
Start |
|
5
|
20 %
Bonus and cashback by promo code revieweek23
|
Start |
McClellan oscillator
McClellan Oscillator shows the width or spread of the market, that is, the market range, allows you to mark upward and downward trends. The indicator is built into specialized terminals for trading in the stock market.
Subsequently, the McClellan oscillator was adapted for forex, in particular to calculate short-term overbought or oversold conditions in the market. The McClellan oscillator is rare for the forex market, but there are some possibilities for its use here.
McClellan Oscillator is based on the difference of fast and slow exponential moving EMA with periods 19 and 39. It can be used to develop Forex strategies in combination with other indicators. This tool refers to market breadth indicators, which are initially based on stock performance data that coincides with the overall trend. If a number of rising stocks are noted, then the trend is upward. But if this growth is supported by a small number of shares, it indicates a weakening trend and we should expect a reversal soon. Similarly, if the downtrend is supported by a small number of falling stocks, it suggests that a bearish trend can soon be replaced by a bullish one.
McClellan Oscillator in the MetaTrader 5 Platform
The oscillator and the McClellan index are not standard tools in the trading terminals. For MT5 the oscillator can be downloaded, for example, here: https://www.mql5.com/ru/code/20687.
Integrate Oscillators for Forex to the terminal can be done in several standard ways. For example, you download the MQ5 boot file to your computer. You need to open it in MetaEditor and add the file to the program. When you open the trading terminal it will already be in the list of custom tools in the navigation bar on the left.
Preset settings of the indicator: base currency – American dollar, fast MA with a period of 19, a slow MA with a period of 39. There is no need to change the settings, because the oscillator works optimally with the existing parameters. Having mastered the methods of trading with the indicator, you can add additional levels to the chart, but it is not necessary, because the oscillator is not designed to determine the overbought and oversold areas, the built-in zero level is enough.
McClellan oscillator signals
In the classic version of the McClellan oscillator shows a signal to buy when the values of the oscillator fall into the oversold zone, usually between 70 and 100, and turn up. The oscillator positioning in the overbought zone from +70 to +100 and reversing downwards is considered a signal to buy.
Exit of the McClellan oscillator above +100 or below -100 indicates an extremely overbought or oversold market and confirms the continuation of the formed trend. If there is no pronounced trend in the market and McClellan Oscillator reaches +100 or -100, it is a signal of formation of a certain trend.
A fall of the McClellan oscillator to 90 and a reversal upwards is considered as a signal to buy. A fall below 100 warns of a possible prolonged downtrend and cautions against buying. For sell signals, the oscillator tracks the mirror situation.
McClellan is characterized by the same Forex signalsthat for many other oscillators. The oscillator line crossing the zero level from the bottom upwards is a signal to buy. Crossing the line of the oscillator zero level downwards is a signal to buy. Also a divergence – the divergence between the oscillator values and the price dynamics – is a classical signal. But in any case, it is recommended to use the McClellan oscillator in forex trading only with other indicators.
Trading strategies based on the McClellan oscillator
No specialized or popular strategies using the oscillator have been created for the Forex market because it is not a popular indicator. When using it, the same principles are applied as in the stock market, but most likely with less efficiency.
The strategy of trading on the McClellan oscillator can be based, for example, only on one signal – the crossing of the zero level. When the oscillator crosses the zero level from bottom to top, it opens a buy position. When the oscillator crosses the zero line a sell position is opened.
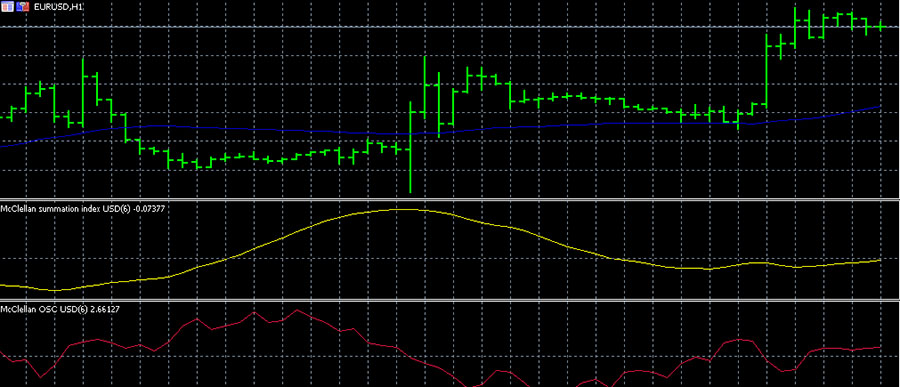
Or a buy position is opened if the oscillator exceeds -70; if the oscillator decreases from +70, a sell position is opened. As an example of using the tool with other indicators, we can present a simple strategy with a simple moving average with a period of 25 (Fig. 2):
Image. 2
According to this strategy, buy positions are opened when prices are placed above the moving average, with the indicator line breaking through the zero level. Correspondingly, sell positions are opened when prices are placed below the moving average.
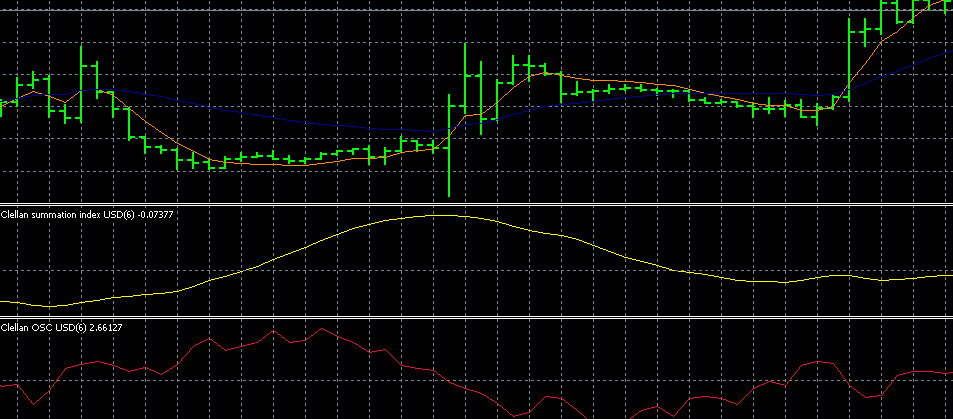
Working with the McClellan indicator implies the mandatory installation of pending orders and stop-losses when implementing any strategy. One of the strategies for trading on a short timeframe involves the use of the McClellan oscillator, the 10-period exponential average and the 50-period exponential average on the price chart (Figure 3):
Image. 3
The signal to buy or sell will be a crossing of the McClellan oscillator, and EMAs are needed to confirm the signal. So, to buy the asset EMA (10) should cross EMA (50) from the bottom up, to sell the signal will be confirmed by crossing EMA (10) from the bottom up EMA (50).
McClellan Summation Index Oscillator
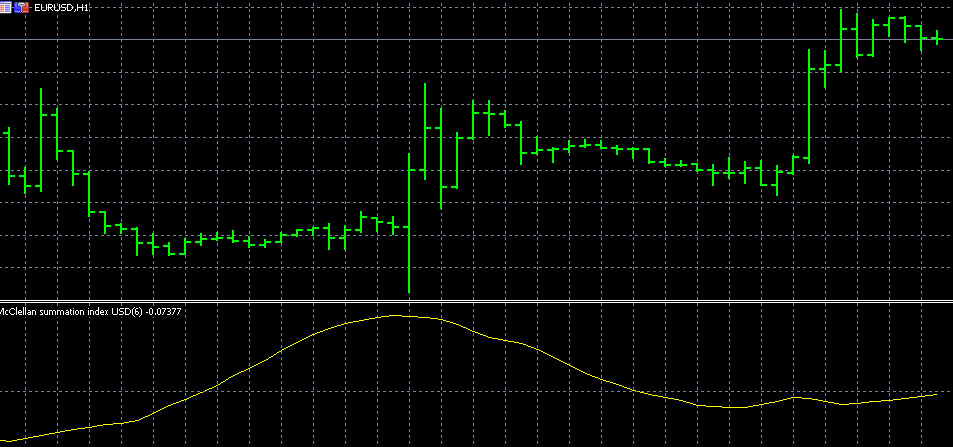
The McClellan summation index (Fig. 4) is built on the basis of the McClellan oscillator indicators and represents their sum. The index performs the functions of the oscillator, but for long-term trading:
Image. 4
The McClellan summation index can be calculated in two ways. The first principle for calculating the McClellan summation index is that the 10% (19-day) and 5% (39-day) exponential moving averages EMA (differences of rising and falling indicators) are subtracted from the McClellan oscillator value.
The full formula for its calculation is as follows:
Summation index = McClellan oscillator index – (10 x 10%-trend) + (20 x 5%-trend) + 1000; where
- 10% trend – 10% EMA from the difference of rising and falling indicators;
- The 5% trend is the 5% EMA of the difference between the rising and falling indicators.
The 1000 level was introduced by the authors of the oscillator in the pre-computer era. The summation index moved in the range from 0 to 2000, McClellans introduced a certain average neutral level of 1000 to make it easier for traders to use the indicator.
The second method of calculating the Index consists in calculating the incremental sum of the McClellan oscillator values using the formula:
Summation index = yesterday’s summation index + McClellan oscillator.
McClellan Index Oscillator in the MetaTrader 5 Platform
The installation of the indicator is also standard. For example, having downloaded a zip file with the McClellan Index to your computer, you need to unzip it into MetaEditor. You can download the file, for example, here: https://www.mql5.com/ru/code/20691. When you open the trading terminal, the indicator will already be in the program. Its settings are also not recommended to change, especially if the formula for its calculation is not quite clear.
Trading strategies based on the McClellan Index
Strategies based on the McClellan Summation Index indicator are carried out similarly to the work with the oscillator. It can be used to develop strategies as a tool for determining longer-term trends. For example, when the market goes down to the -1300 index, a divergence can be expected. If the indicator exceeds +1900 after rising to +3600, we can talk about the formation of an uptrend.
Conclusions
The McClellan Oscillator is not standard for forex, nor is the McClellan Summation Index. But there are traders who use them in their work. It is known that the McClellan indicators can be used in trading quite effectively if you know their drawbacks and use additional tools.
McClellan oscillator has a typical disadvantage – it generates a lot of false signals and generally when trading forex does not give very accurate signals. Traders also note that during the pronounced trends of great strength McClellan oscillator can remain in the zone of extremums for a long time, which makes it difficult to use at those times. It also does not work very effectively on a strong uptrend.
To a greater extent, these tools can be applied by experienced traders, because they are quite complicated to interpret. Information on the intricacies of applying McClellan’s trading tools can be found in publications on stock market trading (Training in Stock Market Trading). In addition, there are quite popular strategies with McClellan indicators for binary options trading.


