Fractals Indicator
Contents
Fractals indicator description
Among the technical analysis tools for forex trading Bill Williams’ Fractals indicator takes a special place because it is based on a special market theory, the fractal theory. A small theoretical excursus in this case is necessary. The fractal theory is based on two simple, in fact, operations: copying and scaling. The term “Fractal” itself has no strict definition, but it has one key characteristic – self-similarity (Fig. 1):

Image. 1
That is, it is a certain number of objects, each of which looks like a set as a whole, for example, a branching tree in which each branch with branches looks visually like the whole tree. Fractals are all around us; almost all social, political, and economic phenomena are fractal – repeating at different scales. Fluctuations in asset prices are also fractals.
The creator of the fractal theory was the French mathematician Benoit Mandelbrot. He also drew attention to the fact that fractal patterns can be traced in stock trading. One day he superimposed the daily price fluctuations on the fluctuations of a longer period and found out that they were similar. It is this similarity that makes it possible to predict the behavior of an asset’s price in the future.
Over time, the theory of fractals gained many supporters. The fact is that it turned out to be the only one claiming to practical justification of the market theory. Before fractals it was considered that there were many objects on the market which reacted to certain events and were corrected by counteractions, i.e. the system was constantly in mobile equilibrium (The whole truth about forex). But studies as far back as the 1950s showed that the model of random corrected fluctuations is not always confirmed empirically. 20 century showed that the model of random corrected fluctuations is not always confirmed empirically and strong price fluctuations occur too often. It was Mandelbrot who questioned the theory of random fluctuations and offered his own explanation.
Wave formula
The theory of fractal price movements uses the “D” dimension derived by the mathematician Felix Hausdorff and the index of the mathematician Harold Hurst – “H”, which corresponds to the Hausdorff fractal dimension as D = 2 – H. This formula shows the possibility to keep a certain trend in a certain period of time.
Thus, in the financial market there can be H = 0.5, when prices fluctuate randomly; H > 0.5, when a pronounced trend dominates; H < 0.5 – flat movement. That is, random fluctuations in the market are not necessary, and the other two basic types of movement are possible, which means that the theory of "random equilibrium" is questionable.
| Broker | Bonuses | Open an account |
|---|---|---|
|
1
|
50 %
Bonus on deposit from $100 USD – promo code WELCOME50
|
Start |
|
2
|
From 25 To 60 %
Deposit increase for the first deposit
|
Start |
|
3
|
Cashback
Refunds of commissions, spreads and other costs
|
Start |
|
4
|
100 USD
Loyalty program remuneration
|
Start |
|
5
|
20 %
Bonus and cashback by promo code revieweek23
|
Start |
And the fractal theory is used as an alternative for it: the price constantly fluctuates and these fluctuations are repeated regardless of the time period, because there are not random players in the market, but traders who have certain preferences – sell, buy or trade in a flat. For this reason the price can first move in one direction (impulse), then in the other (correction), then back to the previous direction and so on. Thus, constant fluctuations form “market waves”, in each of which the following pattern can be seen: “impulse-correction”.
Several waves form an “average” wave, which moves according to the “impulse-correction” pattern, “average” waves form a large wave. A series of waves in a small period of time forms a short-term trend in a certain “average” period – a medium-term trend, large waves reflect long-term trends.
Bill Williams Fractals
The fractal theory was the basis for the work of his indicator Bill Williams, the famous trader, creator of several very popular indicators for forex (Fig. 2). He approached fractals creatively, so his vision of this theory caused controversy and not everyone agreed with it. But nevertheless, his approach also has many fans, and Williams’ indicators are included in the list of preinstalled in trading terminals.
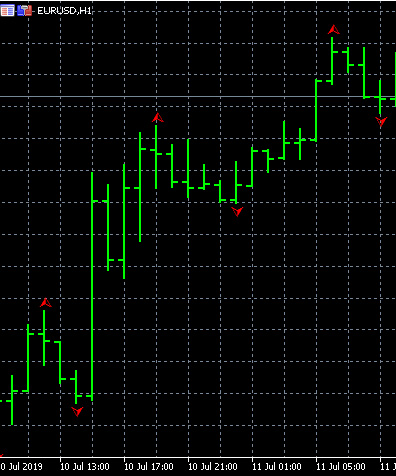
Image. 2
Williams’ fractals are used in a simplified form and represent local extrema on a segment of at least 5 bars (candles). On the price chart they form peculiar patterns, based on which traders can quickly assess the situation on the market (forex analytics). The Fractals indicator in the terminal displays these patterns in automatic mode and shows the direction of the fractal with arrows.
According to Williams, the decision to exit the market according to the Fractals indicator is made after the last bar closes. But, no matter how many bars there are, the first two bars should move in one direction, and the next two – in the opposite direction to the first two. This is the pattern that indicates that we are looking at Fractals. The price on the left side of the pattern is the momentum price, while the right side shows the pullback price – the difference between those prices is called “leverage”. The bigger the leverage, the higher the potential profit.
The principle of the tool is that it always lags by at least 2 bars. This is one of its main drawbacks. For this reason, it is not recommended to use Fractals on the timeframe less than H1, even though many traders do not consider it possible to use the tool on this timeframe. For the most part, the Fractals indicator is adapted for the middle- and long-term timeframes.
Fractals indicator in the MetaTrader 5 platform
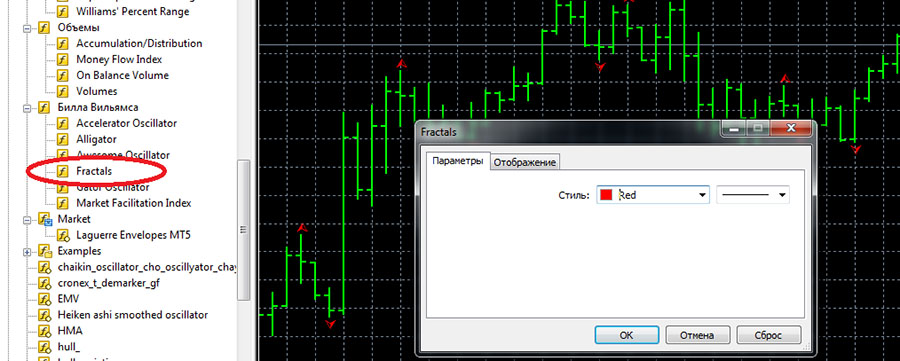
In MetaTrader 5 the Fractals indicator is located in the list of standard indicators in the navigation bar of the terminal on the left side (fig. 3). The only setting you can change is the color of the arrows:
Image. 3
Fractals indicator signals
One of the important advantages of the Fractals indicator is that it shows local extrema and allows you to see significant resistance and support levels. But it is at the breakdown of these levels that the probability of false signals increases. A large number of false signals is one of the typical negative features of the Fractals indicator.
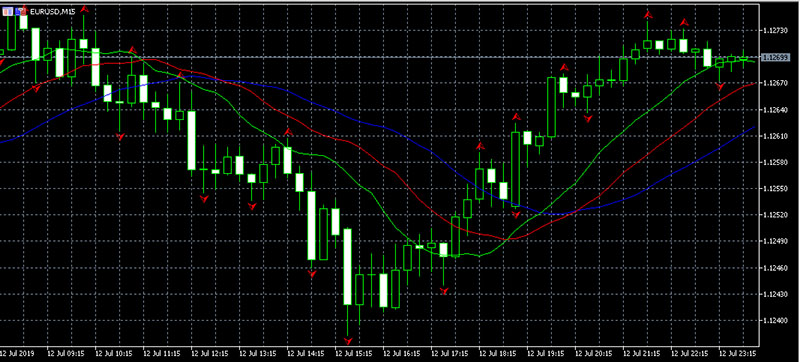
Bill Williams created probably his most popular indicator, Alligator (Fig. 4), precisely to filter out false signals. In particular, he recommended to buy if the Fractals indicator was broken above the “Alligator’s teeth” (red line) and to sell if the fractal was broken below the red line. Also, to prevent false signals the following levels are used Fibonacci.
Image. 4
Fractals are used for trading on the breakdown of levels, and if the price is above or below the level, which shows the previous fractal, then, according to Williams’ own assumption, it is already a breakdown. If the price is above the previous fractal, which is directed upwards, it is a “buyers breakout”; if the price is below the previous fractal, it is a “sellers breakout”. Either way, a trader who sees these breakdowns can open a position.
Another application of the Fractals indicator is trend detection. Fractals indicating a buy are more often seen on an uptrend, on the price chart, and fractals indicating a sell are more often seen on a downtrend. If the price does not overcome the previous fractal, it is likely to indicate a flat, it is confirmed by the formation of a fractal, the opposite of the previous one.
Trading strategies based on the Fractals indicator
There are forex strategies trading using only the Fractals indicator. But their use involves a lot of risk due to the specifics of this tool and cannot be recommended, especially for beginner traders (Forex without Investment and Risk).
The most famous strategy with this tool is “Fractals+Alligator” (Fig. 5), in which it is recommended to use any of the classical trend indicators. Pairs with average volatility are traded on timeframe of M15 and higher. In this strategy, it is considered important not to trade against the Alligator indicators.
Image. 5
First, it is proposed to find at least 5 consecutive bars showing a pattern of a certain directionality – by lows or by highs, with a maximum or minimum must be on the middle bar. Buying is carried out when the price crosses the Alligator’s lines and a fractal appeared pointing upwards, above the “teeth” of the Alligator.
Orders are opened above the closing price of the bar which created this fractal. Selling is carried out when the price has broken through the Alligator lines and a fractal is formed, directed downward, below the “Alligator’s teeth”. Orders are opened 2-4 pips below the closing price of the fractal bar. The strategy is not implemented during a flat, which is indicated by the intertwining of the Alligator lines.
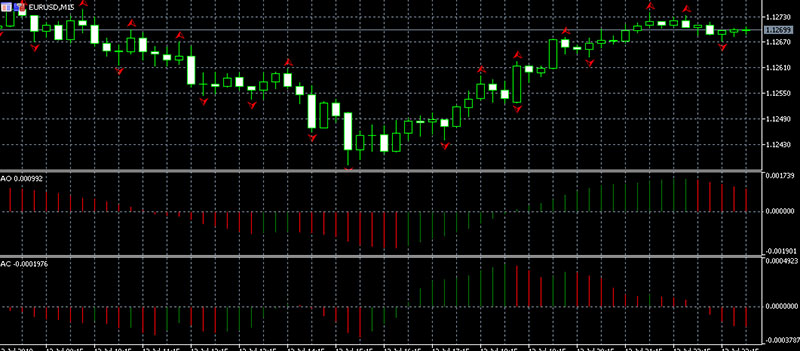
Another Williams strategy using the Fractals indicator uses Oscillators for Forex: Awesome Oscillator and Accelerator Oscillator (Fig. 6):
Image. 6
Within the strategy, buy orders are opened when the price is placed above the red line (“teeth”) of the Alligator, the fractal is broken in the ascending direction, the last two columns of the Awesome Oscillator histogram are colored green, as are the last three columns of the Accelerator Oscillator. Sell deals open, when the price is placed below the “teeth” of the Alligator, the fractal is broken in the downward direction, the last two Awesome Oscillator histogram bars are colored red, as are the last three Accelerator Oscillator bars.
Another strategy uses an indicator Fractals, whose signals are confirmed by a popular classic tool Zigzag. This indicator shows the most significant extrema, which allows you to sift out false fractal signals. Trading is carried out on the timeframe of M30 and above. Orders to buy are opened when a fractal appears, directed downward, and the Zigzag marked a new minimum. Sell trades are executed when a fractal appears, directed upwards, and Zigzag shows a new top.
One of the classic strategies with fractals is the strategy with Fibonacci levels. It is implemented on the timeframe of M15 and larger only in the direction of the trend. The main task is to correctly prepare the Fibonacci grid. To do this, we remove all levels, except for 0.15, -0.15, -0.85, -1.15, that is, on the chart it will look like a channel with two lines, located on both sides of it (Fig. 7):
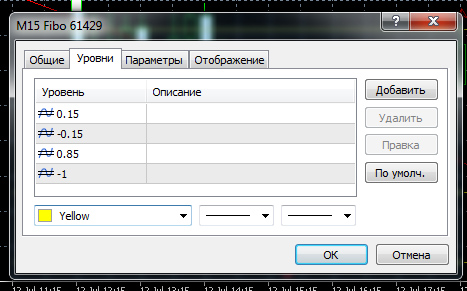
Image. 8
The strategy is implemented when two fractals appear in a row in the same direction, at a distance of 20-100 pips between the upper and lower fractals – the latter is not a necessary condition. After such fractals have been formed, the Fibonacci grid is plotted on the chart. When the third fractal is formed, the corresponding channel line is shifted so that it is drawn through it.
Then two additional levels are drawn: the first is a horizontal line through the second fractal and the second is a vertical line at the intersection of the 0.15 level and the horizontal line. And if the trend is ascending, a buy order is opened, and if the trend is descending, a sell order is opened. Installation of stop-losses is obligatory: when buying – below the third fractal, when selling – above it.
Conclusion
When applying the Fractals indicator, there are a few rules to follow. So, it is considered that it takes longer to form a pattern and it generates more reliable Forex signals. On a smaller timeframe, Fractals generate a lot of false signals. A fractal represents the beginning or end of a trend. If several fractals appear pointing in opposite directions, we should expect a strong trend to form in the direction of the fractal breakdown.
The Fractals indicator allows you to determine the entry points into trading, but it is not recommended for those who are just starting to trade, because it is quite difficult to interpret the tool (Forex Trading Training). Also, it is not recommended to predict prices using only it. Williams himself believed that this indicator is an additional one, confirming the signals of other instruments, not even one. In addition, the signals of the fractals on one timeframe, many believe that it is correct to check on other timeframes.
