Stochastic Indicator (Stochastic)
Contents
What is Stochastic?
Stochastic (Fig. 1) is one of the most famous technical indicatorsif not the most famous, for trading in the forex market. It is one of the classic indicators and has been used for trading since the 1950s, when it was proposed by George Lane, president of Investment Educators Corporation.
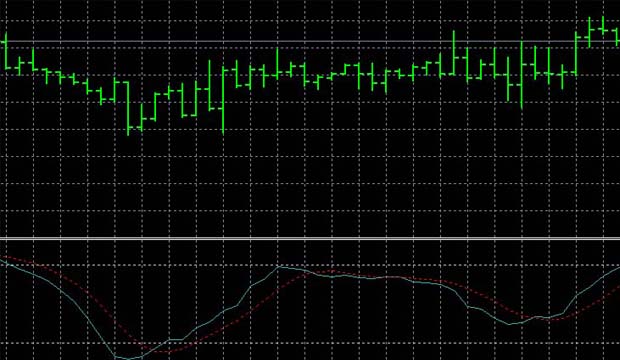
Image. 1
George Lane, creating the stochastic, based on observations of the market, which showed that in a rising trend, the closing price of the next timeframe stops, as a rule, close to the previous highs. In a downtrend, the closing price of the next timeframe stops, as a rule, close to the previous minimum. Stochastic forex oscillator is a tool for measuring price impulses by comparing the difference between the price of the current day and the quote for a certain time before that, expressed as a percentage (forex analytics). The standard stochastic period of 14 days, it is during this period the dynamics of the closing prices of the “Open” in the range between “High” and “Low” is revealed.
The stochastic indicator consists of lines %K – fast and %D – slow, the indicators of which form a “corridor” from 0 to 100, at the highest (High) and lowest (Low) prices. By default, the stochastic control values are 20 and 80 (Fig. 2), used to determine the overbought and oversold condition of the asset. The overbought and oversold levels range from 70-80 to 30-20 and 90-10. The solid %K curve is the basic one for the stochastics. The dotted %D is called a signal curve. The period of the %K curve represents the period of the oscillator. Curve D is a simple moving average of %K, and its period is the period of the stochastic signal curve. Deceleration – smoothing of %K and %D indicators.
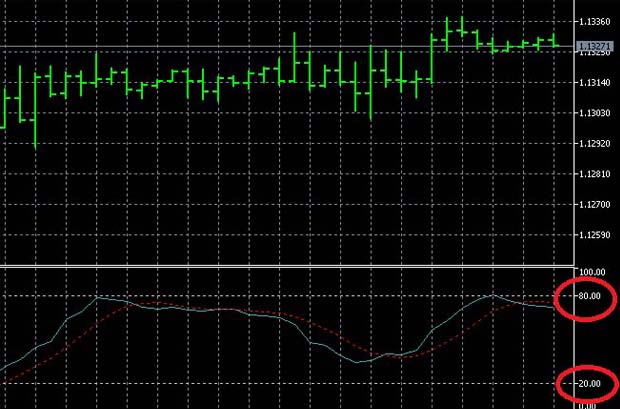
Image. 2
Features of the Stochastic forex indicator
Stochastic can be applied to any timeframe. The oscillator with a shorter period shows high sensitivity to price changes, but also generates a lot of false signals. The long-term indicator generates the most important signals, but misses the small ones, among which there can be profitable. If by trading strategy it is supposed to use only stochastics, it is more rational to use an indicator with a longer period (Forex Trading Training). If the stochastic is used in conjunction with other indicators, it is better to use a stochastic with a short period. In any case, the trader chooses the stochastic parameters based on the strategy implemented. When selecting parameters, it is important to consider the volatility of the market.
Stochastic Signals
The most popular stochastic signals – the behavior of the indicator line: if the line %K or %D falls below 20 %, and then rises – it is a signal to buy. Signal to sell is noted when the indicator chart line rises above 80 %, and then falls below this value. The simple signals include crossing 80% (Fig. 3) and 20%. In the first case the crossing is interpreted as a signal of the end of the uptrend and possible reversal to the decrease. In the second case it is assumed that the downtrend ends and prices may start to grow. The signal indicating a clear uptrend is when the indicator is positioned between 100 and 50, the downtrend is indicated, respectively, when the stochastic is positioned between 0 and 50.
Image. 3
The signal to enter the trade when the trend is developing in any direction is a crossing of the oscillator curves of the level 50. Divergence signals are indicative, such as when prices form new highs and stochastics do not update the previous highs. This demonstrates the beginning of a downtrend and is a signal for opening a sell position. The divergences at 20% and 80% are considered more reliable. Signals of overbought and oversold zones: a reversal below the oversold area is a buy signal, especially when %D is crossed from below to above. The signal to sell is a reversal below the overbought boundaries, especially if %K crosses %D.
Log in to your broker’s terminal, add the Stochastic indicator to the chart and see what comes out
| Broker | Bonuses | Open an account |
|---|---|---|
|
1
|
50 %
Bonus on deposit from $100 USD – promo code WELCOME50
|
Start |
|
2
|
From 25 To 60 %
Deposit increase for the first deposit
|
Start |
|
3
|
Cashback
Refunds of commissions, spreads and other costs
|
Start |
|
4
|
100 USD
Loyalty program remuneration
|
Start |
|
5
|
20 %
Bonus and cashback by promo code revieweek23
|
Start |
Forex strategies using the Stochastic
The stochastic is used in so many strategies, including as the main strategy indicator, which confirms its value for traders. One popular strategy involves using two stochastics with different time periods and levels. For example, a fast stochastic (5, 3, 3) and a slow stochastic (21, 9, 9), with oversold and overbought levels of 20 and 80 (Fig. 4). The strategy is based on the slow oscillator. The strategy is implemented on a steady trend.
The signal to open a deal, in the oversold area – to buy, in the overbought area – to sell – occurs when there is a crossing of the lines %K and %D and appears fast stochastic in the oversold or overbought zone. The fast stochastic must be confirmed by the same value of the slow stochastic. Often, stochastics are used in strategies using a moving average. One such strategy uses stochastics (5, 3, 3) with an additional level of 50 and two exponential moving averages with periods of 50 and 120. Only the trend is traded.
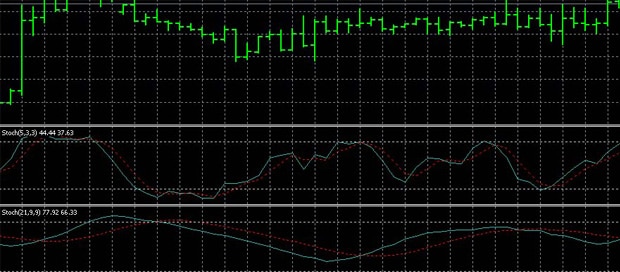
Image. 4
Moving Average EMA in this strategy is necessary to determine the entry point. Positions to buy open when the EMA (50) > EMA (120) when the line %K from bottom to top crosses the line %D at a level no higher than 50. Sell positions are open when the EMA (120) > EMA (50), when the %K line crosses the %D line from the top downwards on the level not lower than 50. Stochastic may be combined with three moving averages. For example, with periods of 4, 13 and 50.
Stochastic is set with the settings of 12, 9, 5, and two levels – 40 and 60 are tracked. As a signal to buy the EMA (4) and EMA (13) lines will cross the EMA (50) line from bottom to top, the stochastic signal line should cross the 60 level in the same direction. The signal for selling will be crossing by EMA lines (4) and EMA (13) of EMA line (50) from above downward, the signal line of stochastics should cross the level of 40 from above downward.
A simple strategy is considered to be the combined application of stochastics and RSI indicator (Fig. 5). Stochastic settings (5, 3, 3), RSI is set with period 14, with level 50. The signal comes from the RSI, it must be confirmed by stochastics. Signal to buy is a move of RSI above level 50, which is confirmed by the crossing of stochastics of level 20 from below upwards. The signal to sell is when the RSI crosses below the 50 level, and the stochastic must cross the 80 level downwards.
For scalping, the “Stochastic+ADX+Sliding Averages” strategy is often used. The stochastic indicator is set with the standard settings of 5, 3, 3, with an additional level of 50. ADX Oscillator is set with period 14, with an additional level 20%. And at. Timeline three exponential slides with periods of 5, 15, 30 are set.
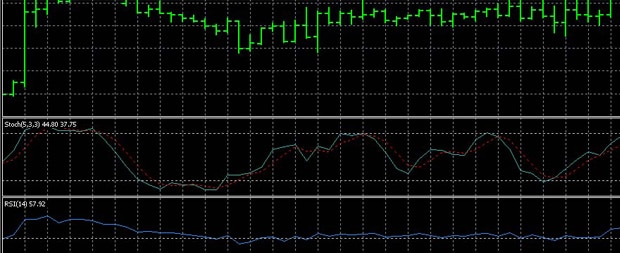
Image. 5
The signal to buy will be the crossing of %K, which crossed the level of 50 from below, the placement of the ADX line above the level of 20% and the placement of moving averages from above to below in the following order: 5 (EMA), 15 (EMA), 30 (EMA). The %K line will signal a downward crossover of 50, while the ADX line is placed above the 20% level, and the moving averages are placed in the following order from top to bottom: 30 (EMA), 15 (EMA), 5 (EMA). Another short-term strategy involves the use of stochastics (5, 3, 3), RSI (14), MACD oscillator (default) with moving averages WMA (5), SMA (10) on the 10-minute timeframe.
The buy signal for this strategy is when the WMA line (5) crosses the SMA line (10) from bottom to top, while stochastic indicates upward movement, RSI is above 50, MACD is greater than 0 and its averages are crossed in the ascending direction. A signal to sell would be when the WMA (5) line crosses the SMA (10) line from up to down, while stochastics are showing a downward movement, RSI is below 50, MACD is below 0 and MACD averages are crossing in a downward direction. Stochastic is used in strategies with Williams indicators (Fig. 6).
For example, one of them uses in addition to stochastic the RSI indicator and the Williams %R indicator. Stochastic is set with settings (30, 8, 18), RSI with a period of 21, parameters Williams Percent Range (% R) – by default. The first step is to determine which trend is dominating the market. Three timeframes are considered for the strategy: H4, H1 and M15. The first signal on the timeframe H4 is marked during the trading process, which should be confirmed by the signal on H1 and then on M15. The deal is opened only when the signals of all three timeframes are agreed.
Image. 6
If RSI is above 50, stochastic is up, and prices are declining (i.e. there is divergence), and Williams% R is close to -80, this is an uptrend. If RSI is below 50, stochastic confirms a downward trend and Williams% is closer to -20, it means that a downtrend prevails. The search for specific entry points begins with the Williams Percent Range (% R) with confirmation from other indicators. Another strategy uses a stochastic together with Bollinger Bands, Bollinger Bands (Fig. 7).
Indicators are set with the standard settings. Trading is done on timeframes from M15 to H1. The signal to buy will be a price crossing the bottom line of the Bollinger Bands, while the fast stochastic curve crosses the slow curve from bottom to top. The signal to sell would be if the price crosses the upper line of the Bollinger Bands, while the fast stochastic line crosses the slow stochastic line from the top downward.
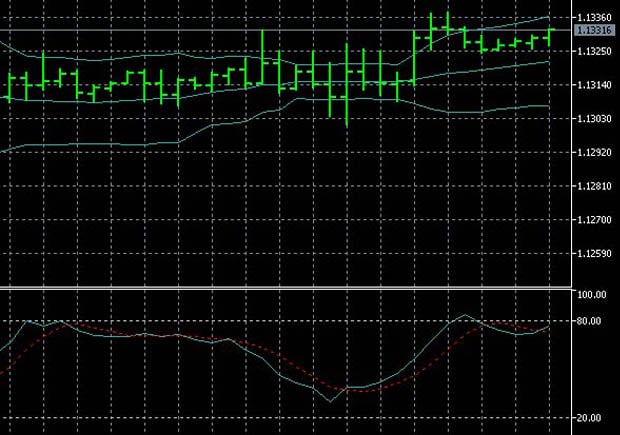
Image. 8
Stochastic is also used in strategies with Fibonacci numbers. For example, such a strategy is created for the H1 timeframe for highly volatile assets. Stochastic settings (14,3,3), but with only one line – %K. The Fibonacci grid is drawn from the low to the high of the previous day. In this strategy, you should wait for the price to break the maximum or minimum of the previous trading day. Stochastic should confirm this signal. If you open a buy position, the stochastic should cross the 80 level, if you open a sell position, the stochastic should cross the 20 level. The trades are closed either partially or completely at Fibonacci 161.8%.
Conclusions
Stochastic is considered one of the most effective trading oscillators. It is used on all timeframes and almost all assets. Stochastic is characterized by standard disadvantages for oscillators – lagging signals and generation of false signals. But they can be minimized by adapting the stochastic to a particular strategy. The optimal solution would be to use stochastic with other indicators, first of all, with trend indicators. In this case, the efficiency of the stochastic is noticeably higher.
