Fibonacci Levels
Contents
What are Fibonacci numbers
Fibonacci numbers are natural integers arranged in such an order that each successive number, starting from the third, is the sum of the previous two numbers: 1, 1, 2, 3, 5, 8, 13, 21, 34, 55, 89, 144… – this sequence of numbers is infinite (more on Wikipedia). The laws of the Fibonacci number sequence are manifested in nature and in human activities – mathematics, architecture, painting (Fig. 1)
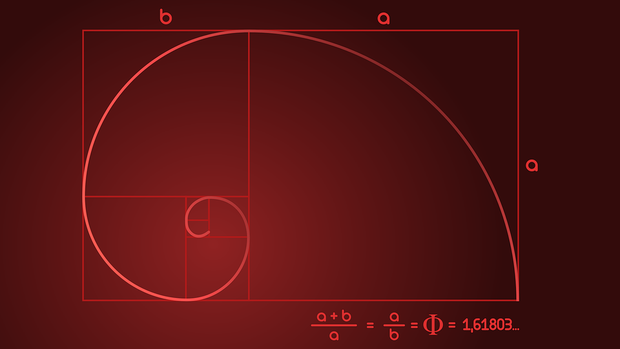
Image 1
In European mathematics, the unusual properties of series of numbers were described by Leonardo Fibonacci, an Italian mathematician who lived in the 12th and 13th centuries.
The applicability of the Fibonacci number series for trading was described in 1939 by engineer Ralph Nelson Elliott (Wikipedia) in the economics magazine Financial World Magazine.
Elliott emphasized to traders that price fluctuations – waves – in the market are subject to a rhythm: the price rises, then falls, the price impulse is always followed by a rebound.
Waves by height and length are correlated according to Fibonacci coefficients, for example 0.382, 0.50, 0.618 and 1.618. As the price rises, the ratio of each number to the next one is close to 0.618; as the price falls, the ratio of the next number to the previous one is close to 1.618. Accordingly, there is also the ratio of each number to the number located through the nearest number in the row: when the price increases, this ratio is close to 0.382, when the price decreases – 2.618.
Fibonacci numbers 4.235; 2.618; 1.618; 0.618; 0.382; 0.236 and its median 0.5 are used most often in trading.
Fibonacci levels on stock charts
Fibonacci levels are available on almost any trading floor (Fig. 2) in the list of indicators, for example, Binomo (bonus 100% to deposit by promo code REVIEWEEK100 – Activate) or Olimp Trade. In trading on trading floors Fibonacci levels are used to predict trend changes, identify reversal resistance and support lines and the size of possible price fluctuations.
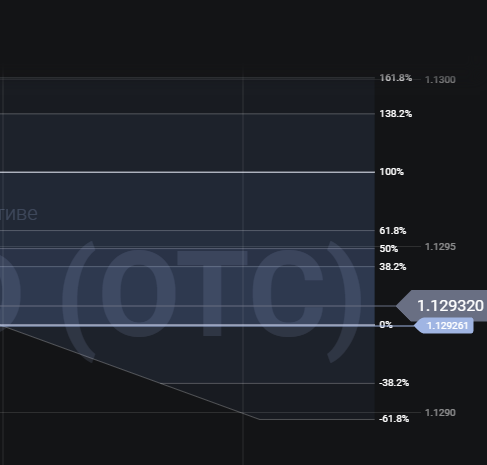
Image 2
For this purpose, a grid of these levels is plotted on the trading floor chart by reference points. Accordingly, it is first necessary to choose the right anchor points. Extremes are most often used as them – minimums and maximums, support and resistance lines.
It is necessary to take into account the trend dynamics before drawing the grid, because any trend is a correction of the previous trend, which develops in accordance with the Fibonacci numbers. The grid is stretched between the maximum and minimum values of the price on the chart, and the Fibonacci levels are plotted between these values.
The reversal is expected at points close to the Fibonacci levels. What the reversal will be, is determined according to the Fibonacci coefficients, respectively, the trend is corrected to values close to 38%, 50% and 62%.
Fibonacci lines are essentially support and resistance levels. These levels are crossed or bounced by price according to the Fibonacci numbers, which allows you to predict how much price will move.
The Fibonacci grid (Fig. 3) is used in any dynamics – both in the strong movement and in the flat. It is believed that Fibonacci patterns are more clearly manifested on long timeframes.
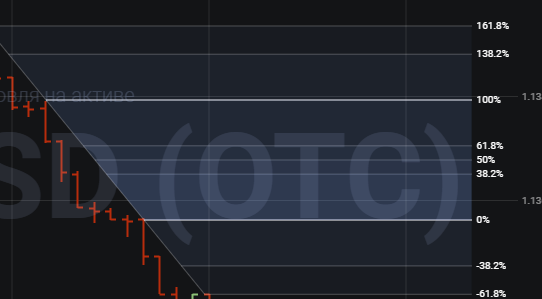
Image 3
Fibonacci levels allow to determine entry or exit points quite well. But they must be used in conjunction with other tools and indicators.
Fibonacci Correction Levels
The calculation of Fibonacci retracement is based on the observation that every price movement ends with a retracement – a bounce in the opposite direction to the trend.
The Fibonacci retracement level is determined after a distinct price movement, for example, when the price has risen. The height of the upward momentum is divided according to the Fibonacci numbers. Horizontal lines are drawn through the obtained marks – possible price bounce levels.
The trading is carried out from these levels, i.e. the orders are placed on the values corresponding to the Fibonacci ratios: 23.6%, 38.2% etc. When the price breaks through the level of 50% (Fig.4) traders do not expect a correction, but a trend reversal.
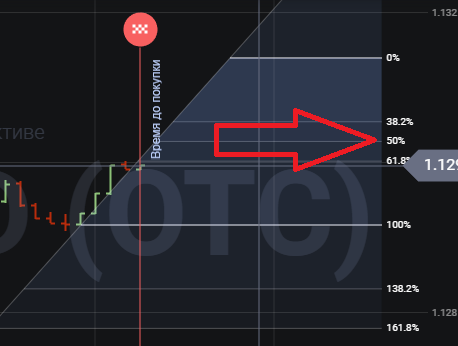
Image 4
On the chart, on the Fibonacci grid, the correction lines are lines with values from 0 to 100%, i.e. levels: 38.2%, 50% and 61.8%. This is the so-called “first grid” of Fibonacci retracements.
Impulse Fibonacci levels
Impulse – the main trend, which is interrupted by a correction. To place the Fibonacci grid and further forecasts of price behavior, it is important to determine the price impulse.
The Fibonacci grid is placed on the wave – the maximum or minimum – of the impulse. A line is drawn through the extremum, the impulse level, from which the correction begins.
It is believed that within one cycle there are eight waves, in a rising market 5 impulse waves show growth, 3 waves show decline; in a falling market 5 impulse waves show decline, 3 waves show growth.
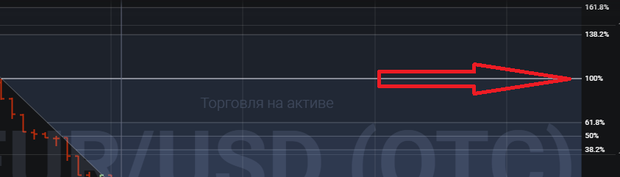
Image 5
Traders try to accurately calculate the entry point to trade on an impulse wave, because Fibonacci patterns are observed most accurately on it.
On the chart, on the Fibonacci grid, the impulse lines are lines with values from 100% (Fig.5) and above, the main ones are 161.8% and 200%. This is the so-called “second Fibonacci grid,” the impulse grid.
Channel, arcs, fan, extensions
The Fibonacci Channel (Fig. 6) represents two main lines on the chart, which are drawn diagonally, sloping in the direction of the trend, along the highs and lows. Above the channel, additional lines are drawn at the levels of 23.6%, 38.2%, 50%, 61.8%, 76.4%, 100%, 161.8%, 261.8%, 423.6% from the channel.
These lines will become resistance and support lines after price begins to correct when it exits the channel. The channel is needed to clarify corrective price movements.
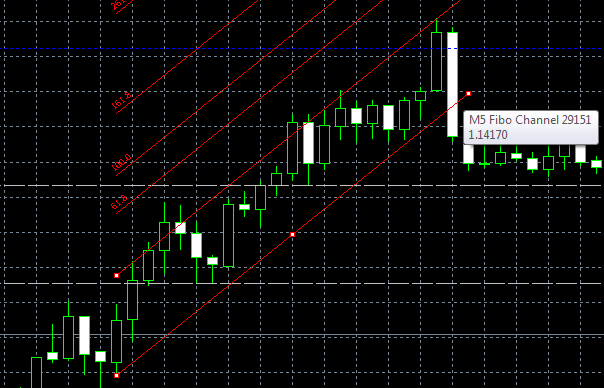
Image 6
Fibonacci Arcs (Fig.7) are mainly used during a flat period to refine trend reversal predictions.
The arcs represent three semicircles, which are built based on the minimum and maximum points of the trend. On an uptrend, the center of the arcs is the maximum. On a downtrend, it is the minimum. The first and the third arcs are built on coefficients 38.2% and 61.8%. The second arc is based on the coefficient 50%.
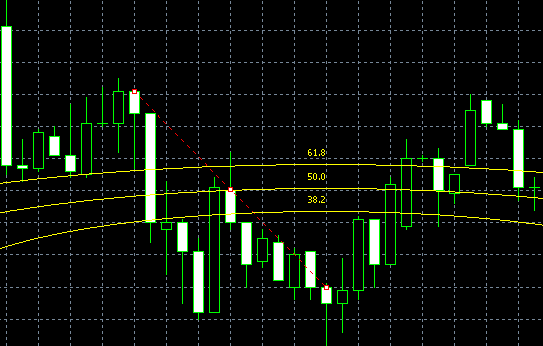
Image 7
The arcs show not only how the price has changed, but also over what period of time – the more time it took to correct, the larger the radius of the arc, the less time – the smaller the radius.
The Fibonacci Fan is another tool based on the Fibonacci numbers. It is used to clarify corrective movements and is built on corrective levels. That is, it is necessary to build correction levels on the grid beforehand.
There are several types of Fibonacci Fan, among which direct, correction and built-in are most commonly used.
The Fibonacci Straight Fan (Fig. 8) is based on the Fibonacci levels by the points of minimum and maximum for the uptrend and the points of maximum and minimum for the downtrend. The straight fan is optimal for the correction up to the level 23.6%. Then a new fan is built. Therefore, it is considered preferable to build this type of fan on the flat.
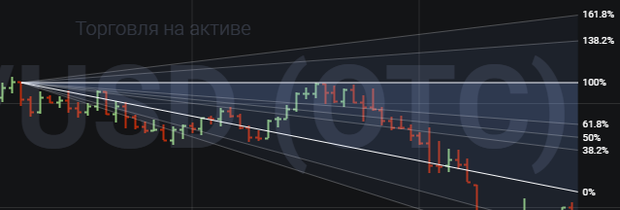
Image 8
The Fibonacci Correction Fan is built after breaking the level of 23.6%. In this case, the maximum of the uptrend or the minimum of the downtrend, from which the fan was built earlier, remains the same, but the second point is transferred to the top of the first corrective wave. When the trend further develops, the point is transferred to the next tops, according to the 50% and 61.8% ratios. If the correction breaks 23.6%, but does not reach 61.8%, the second point is transferred to the next corrective wave.
If the price breaks through 61.8%, it is likely that the trend changes and the fan is rebuilt in the opposite direction. The zero point remains the same, the second point is marked at the top of the wave, which was formed before the corrective level of 61.8% was broken.
The Fibonacci extension is used to determine the end point of a correction. It is constructed by two trend waves in the direction of the third anticipated wave. The line of the first wave is built at the turning point of the trend. The line of the second wave – a corrective with respect to the first wave, it is drawn at the point of the beginning of the correction and to the end of the correction – this point will be the beginning of expansion. A vertical line is drawn through this point, and the Fibonacci levels are plotted: 61.8%, 161.8%, and so on.
Fibonacci levels on the binary options chart
On trade binary options platforms You can find a wide range of instruments based on Fibonacci. And quite a few strategies are based on them. In particular, Fibonacci levels are used for trend trading to determine if the correction is complete.
First, the trend direction is determined, the wave movement is marked, and then a grid is drawn using the Fibonacci Lines tool. On an uptrend the lines are marked from the maximum to the minimum, on a downtrend from the minimum to the maximum. The option is opened Call when the correction level 61.8% is touched in the direction of the main trend.
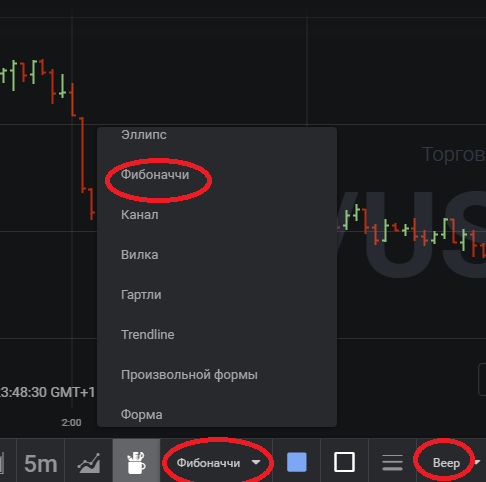
Fig. 9
Fibonacci levels on the Forex chart
Fibonacci indicators are included in the list of standard indicators on forex trading platform. In order to correctly determine the Fibonacci lines, it is necessary to determine the point of trend change to the opposite one and draw lines from the point where the trend changed to the point where the trend started. Then, the trading strategy is applied where the orders are placed considering the expected price according to the Fibonacci coefficients. It is considered that the level of 23.6% does not show the strong enough movement to work with, this level should always be confirmed by additional instruments. The level 38.2% shows a strong impulse. The level 50% is a less strong level, but starting from 61.8%, the levels that show strong impulse follow.
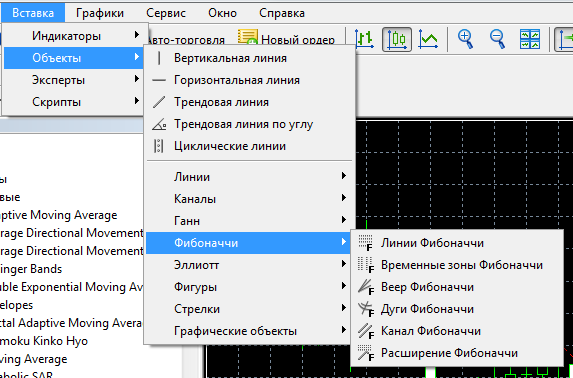
Fig.10.
Fibonacci levels in cryptocurrency trading
Overall, cryptocurrency trading using Fibonacci levels is the same as similar methods for binary options and forex. But the nature of cryptocurrencies is such that you should not expect high accuracy from the indicators.
Nevertheless, as practice shows, at trading cryptocurrencies the points for an entrance into the market are favorable at levels 23.6%, 38.2%, 50.0%, 61.8% and 76.4%. In any case, when trading at the levels it is necessary to put stop-losses – on the other side of the nearest Fibonacci level.
Conclusions
Fibonacci lines are a rather popular and frequently used tool in trading. It is based on traders’ need to streamline trading, bring more logic and consistency into trading operations and forecasts. At the same time, there are traders who doubt in applicability of Fibonacci numbers in practical trading. In any case, it is recommended to use Fibonacci indicators together with other indicators.