EMA (exponential Moving Average) Indicator
Contents
- 1 EMA indicator description
- 2 Calculation formula
- 3 Advantages of the indicator
- 4 How to add EMA to MetaTrader 4?
- 5 How to add EMA to MetaTrader 5?
- 6 How to add EMA to the broker’s terminal?
- 7 How to install the indicator in the terminal?
- 8 EMA trading signals
- 9 EMA signals in MetaTrader 4
- 10 EMA signals in MetaTrader 5
- 11 EMA Signals at Olimp Trade
- 12 EMA signals in Binomo
- 13 Trading Strategies with EMA
EMA indicator description
Constant search for sources of generating accurate data about signals – one of the main problems that a player who is just starting his first steps in the binary options trading. He wants to get accurate market data and make his work much easier, which leads him to get acquainted with means of analyzing the dynamics of assets. Indicators are the first thing he gets acquainted with in the market.
EMAThe Exponential Moving Average is not just an interesting tool and another type of Moving Average, perhaps the most common and actively used in different systems. This is actually a powerful algorithm that allows the player to get the most out of the work. EMA – and not as simple as SMAbut also not as complex a tool as WMA. It appeared when it was necessary to neutralize the lagging weakness of its predecessor – the SMA. Thanks to the EMA it became possible to smooth the effects of price volatility and work with a clearer picture of price trends. When you add it to the chart, you can configure the parameters that will depend on the type of trade, asset, peculiarities strategies etc. Its main element is the price at which the bar closes. This price is used when it is displayed in the main space of the terminal.
Its similarity with the SMA is that here, too, all data is based on the concepts of “value” and “period”. But there is a significant difference between the two tools: the exponential uses more recent price data, which gives more weight to take advantage of the resulting rapid reaction to market dynamics.
Because it reacts faster to the dynamics of the asset, there are more false signals, in addition, it is better not to use it when the market is sideways. Such merits of this tool could not but be appreciated by the players, so most of the indicators and techniques are based precisely on its readings.
Log in to your broker’s terminal, add the EMA indicator to the chart and see what comes out
| Broker | Bonuses | Open an account |
|---|---|---|
|
1
|
50 %
Bonus on deposit from $100 USD – promo code WELCOME50
|
Start |
|
2
|
5 %
Bonus when depositing via USDT (TRC20)
|
Start |
|
3
|
Cashback
Refunds of commissions, spreads and other costs
|
Start |
|
4
|
15 %
Bonus 15% on deposit by promo code iCGSbEgiAR
|
Start |
|
5
|
100 %
First deposit bonus
|
Start |
Calculation formula
When calculating the index of this instrument, it is customary to add to the previous value of the moving average a specific fraction of the current closing value data. Here significant attention is paid to the data on the latest closing prices. As a result, its calculation looks like this:
EMA = (CLOSE (i) * P) + (EMA (i – 1) * (100 – P), where:
CLOSE (i) – indicator of the closing price of the period,
EMA (i – 1) – the value of the moving average of the previous period,
P – the share of using the value of the price.
Advantages of the indicator
Once on the market, EMA became incredibly popular and was immediately included in a number of popular strategies. Of course, it has become so widespread due to a whole set of advantages. First of all, it is a simple and understandable tool, which can be used by a trader with minimal knowledge about the market. Thanks to the exact readings, the player can get information about the behavior of the asset easily and in an accessible form. The EMA is a modified and perfect tool that takes into account the values of simple and weighted moving parameters. It allows you to track the dynamics of the asset more accurately, to make more confident decisions about entering the market and risk-free encounter a sharp change in the trend. Its another advantage is that its calculation takes into account fresh data, but also in general all the prices of the previous time interval, which makes its information more relevant to the trader.
It reacts faster to changes in trends than a simple moving average, and its rapidity of reaction is one of its strongest virtues. When working with its indicators it is worth remembering that shorter periods lead to the fact that the instrument becomes more sensitive to the price dynamics, constantly changing direction. This is not only an opportunity to smooth the price, but also a quick reaction to its slightest changes, so for those who prefer to trade intraday, this is an ideal solution.
Long periods allow it to be stable to price fluctuations, the turns following it will be less. Therefore, we can conclude that it shows itself better in a long trend, and its signals are stable and will definitely help the trader to make a decision to enter the trade. This is the reason why the EMA is used in strategies to confirm the current picture. Here, by adjusting the index of its period, you can achieve the desired result and refine your trading to get a stable income.
Eliminating the lag problem, this tool first looks at the price information at the moment, with the shorter the time interval specified, the greater the weight of the price data will be. Since this indicator is considered as a trend indicator, its main task is to find the market direction, and if the market has a clear upward trend, you can buy an option, and vice versa, if it has a downward trend. It will also help to identify its important phase – the flat, when the market is stomping on the spot, at these moments it is worth not to use it in the work. It is often used successfully as different levels, such as resistance/support, here its ascending line is the lower boundary of levels, and the descending line is the upper one.
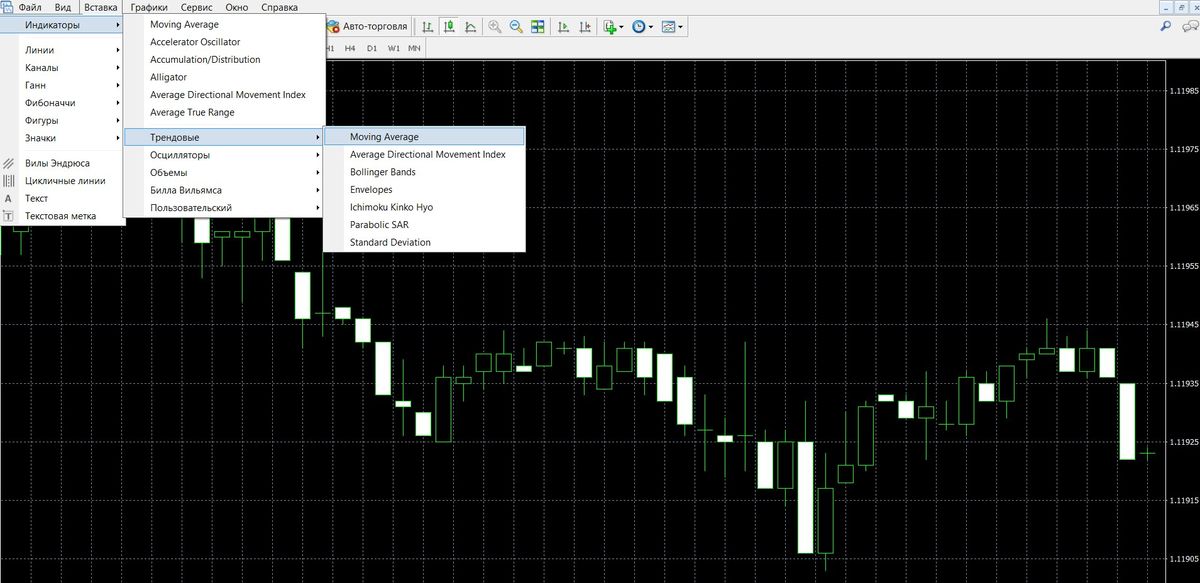
How to add EMA to MetaTrader 4?
This program, familiar to every trader, as part of the standard tools contains and Moving Average. To do this, just follow this path in the upper left menu: Indicators – Trends – Moving Average:
Then the window of its settings will open, where you can work with its parameters, including the period, select the type of display of the indicator:
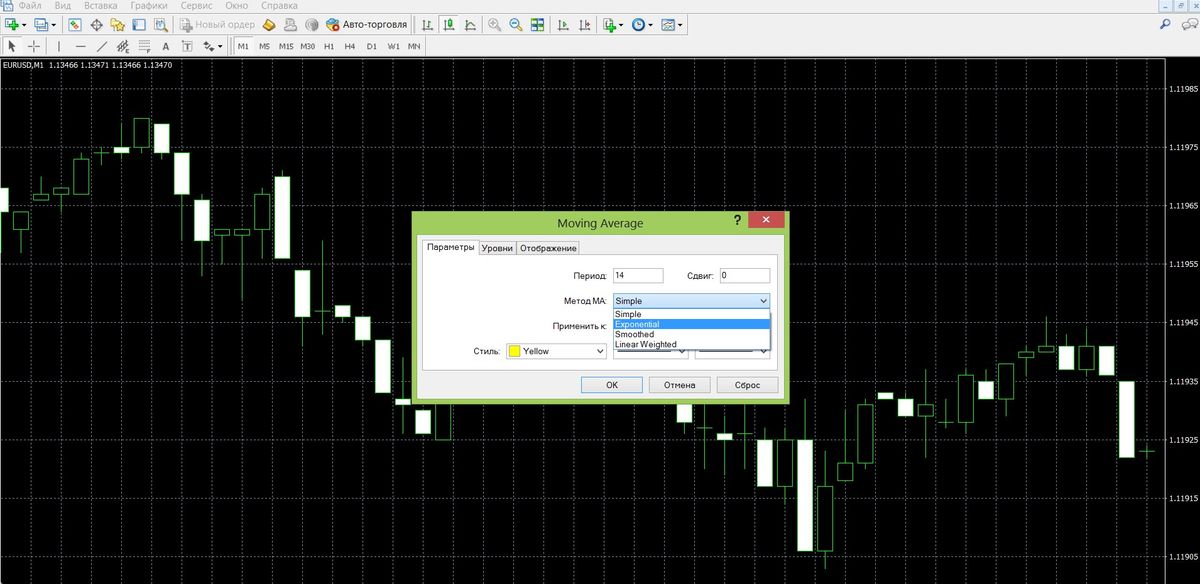
Once the tool is ready, you can add it to the graph by clicking the “OK” button:
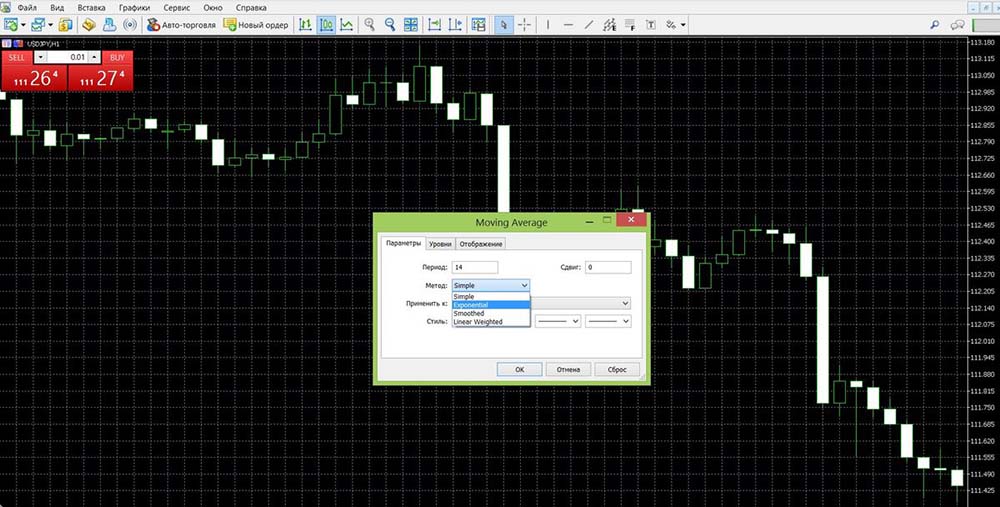
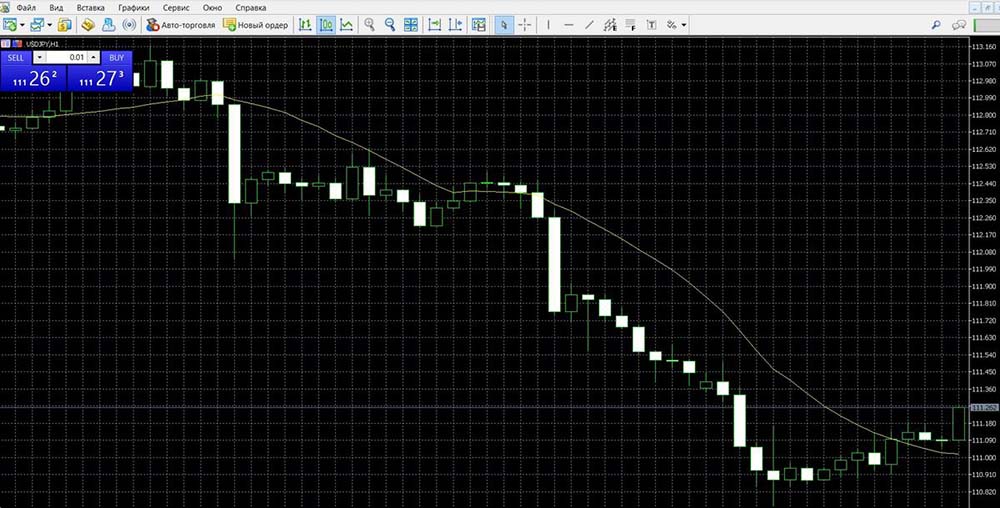
How to add EMA to MetaTrader 5?
In this new generation platform, the process of adding standard instruments, which include the indicator we are considering, is the same as in MT4. Going to the list of trend instruments, it is necessary to select MA:

Next, by selecting the MA type – EMA and making the necessary settings, you can add the slider to the main workspace by clicking on the “OK” button:
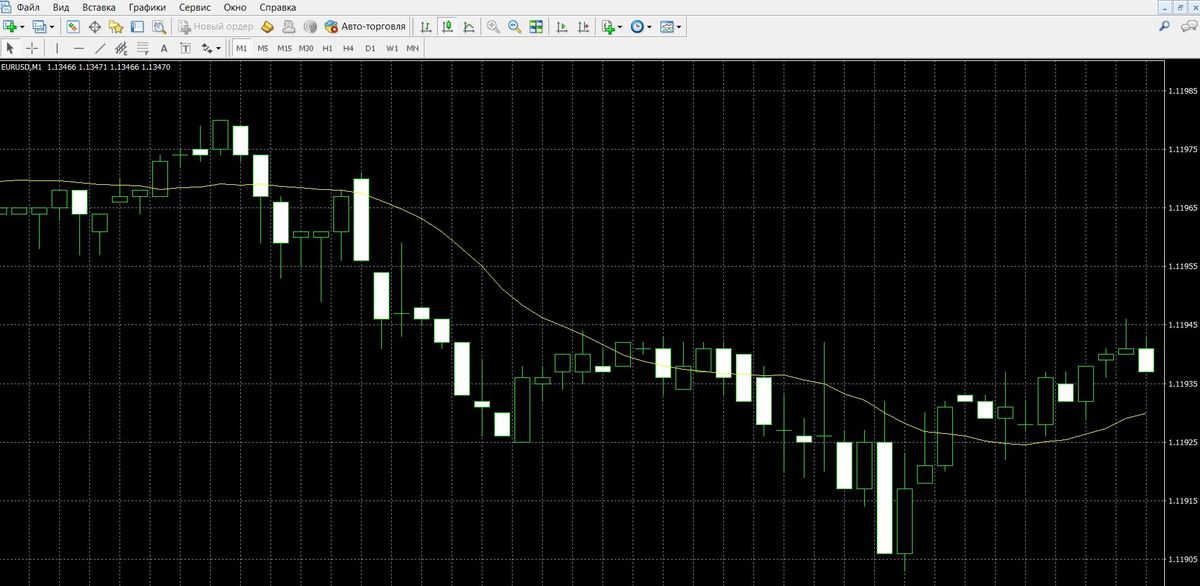
After that, the graph looks as follows:
How to add EMA to the broker’s terminal?
- Finmax
In this trading program at the moment available only 4 indicators among them is a kind of moving average – SMA, but with this tool can not make any adjustments, to change its type, for example, the EMA, which is inconvenient for investors:
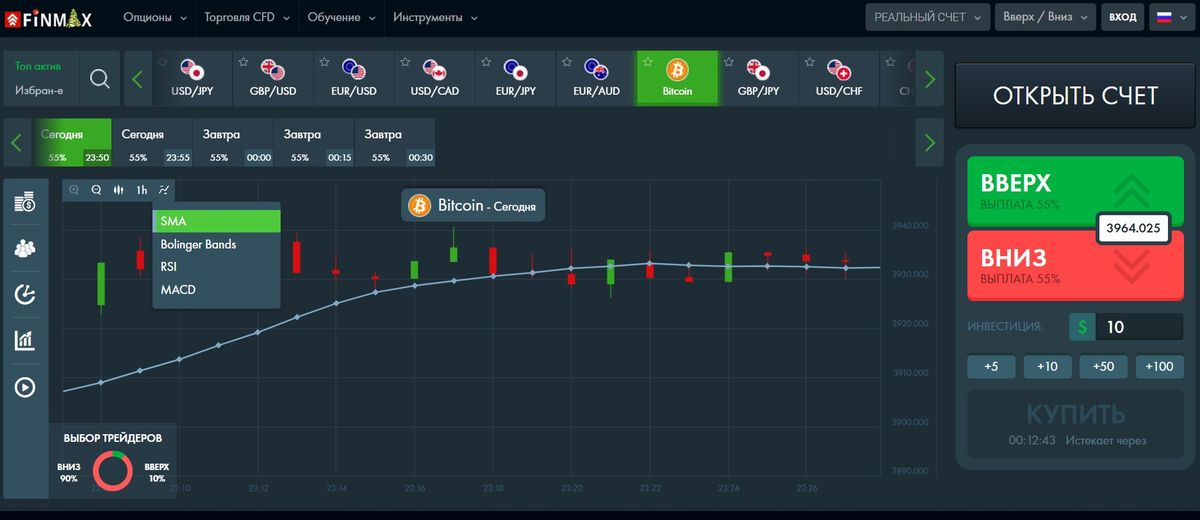
This binary broker (site) an impressive set of tools for analyzing the dynamics of instruments is presented in the terminal. By clicking on the “Indicators” button right in the workspace of the program, you can immediately select the exponential sliding indicator:
The tool is immediately added to the main workspace. A settings window is also available:
Having prepared it for work, you can minimize this window. In this case the tool is automatically updated and takes into account all the settings entered by the user. The graph is ready to work and takes the following form:
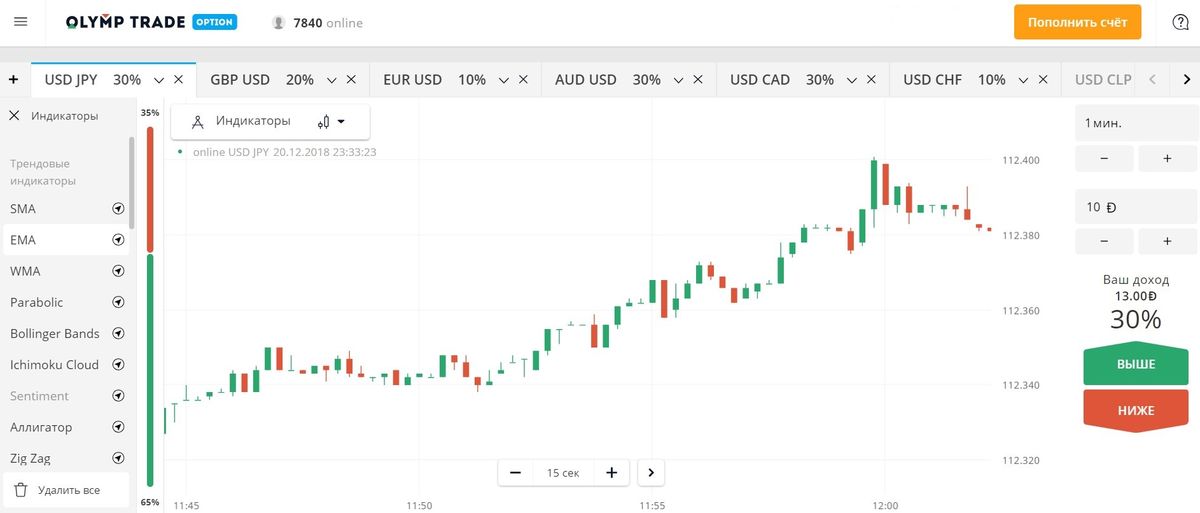
This one of the young and ambitious brokerage organizations is serious about its service and, of course, contains a large set of tools for technical analysis. By clicking on the button “Indicators” at the very bottom of the platform, you can go to the list of these tools:
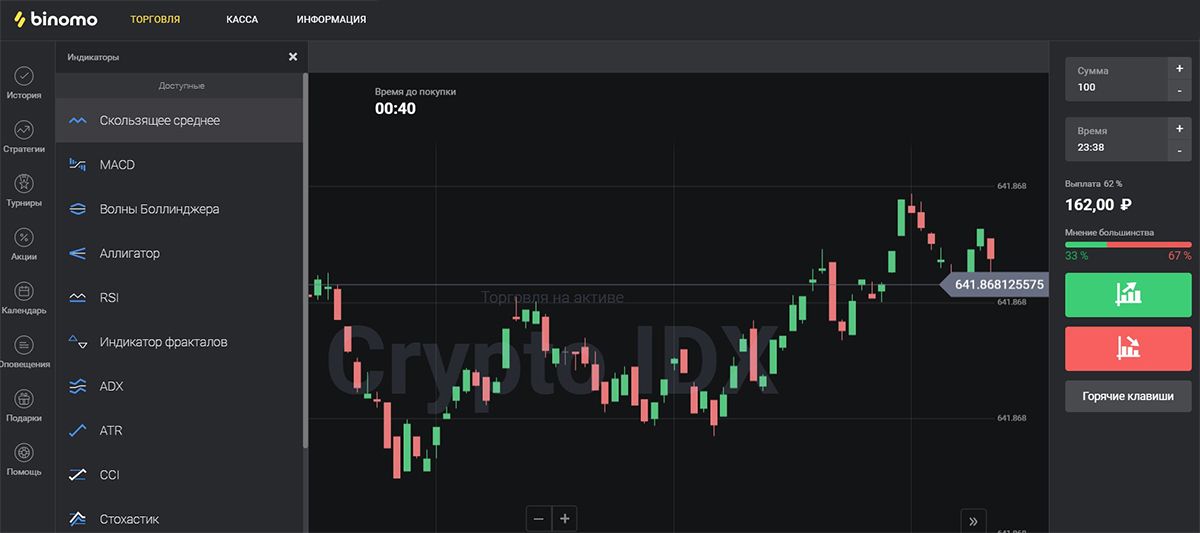
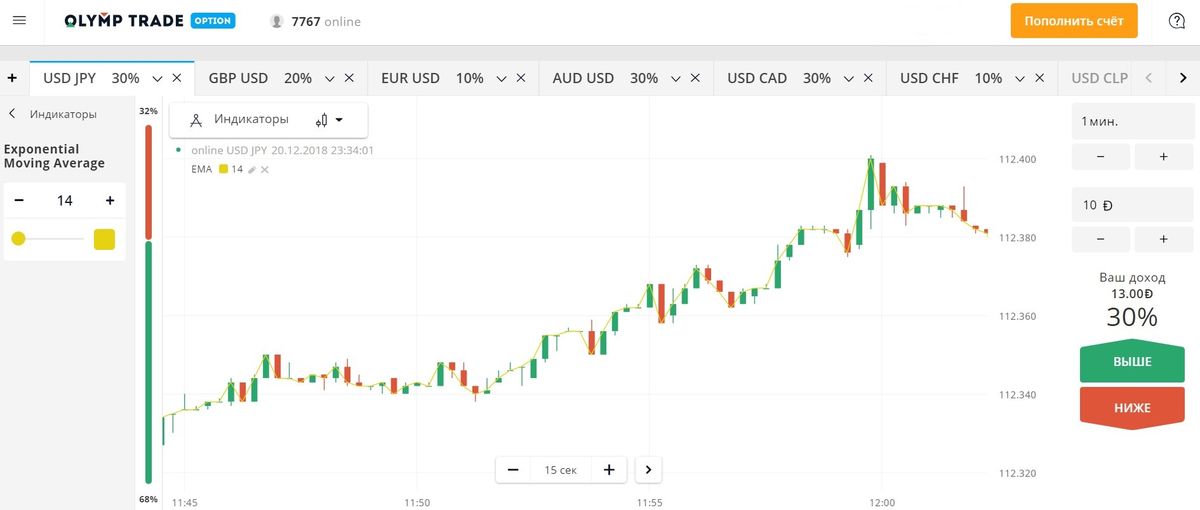
In addition to the ability to work with the Moving Average here you can add its types to the chart, including the EMA. Here you can also perform all its settings:
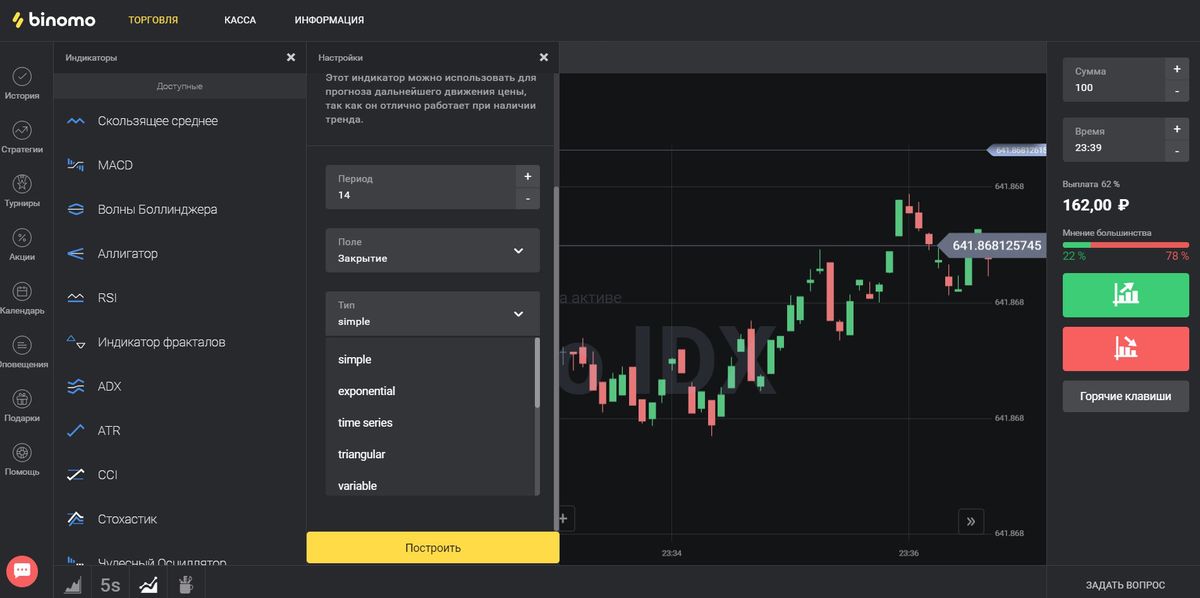
Next, having prepared the tool for work, you can add it to the chart by pressing the “Build” button. Now the workspace of the terminal takes the following view:
How to install the indicator in the terminal?
In trading, it is of great importance to be user-friendly and to have advanced features so that the player can implement all his ideas here. Installing indicators in platforms is not such a common option, but it is interesting for traders. In conventional platforms MA is a basic element and it is understandable, acquaintance with the market often begins with its signals. And yet, it may be that this tool will not be in the platform, so in this part of the article we offer instructions on how to install MA to the MT4 platform quickly and easily.
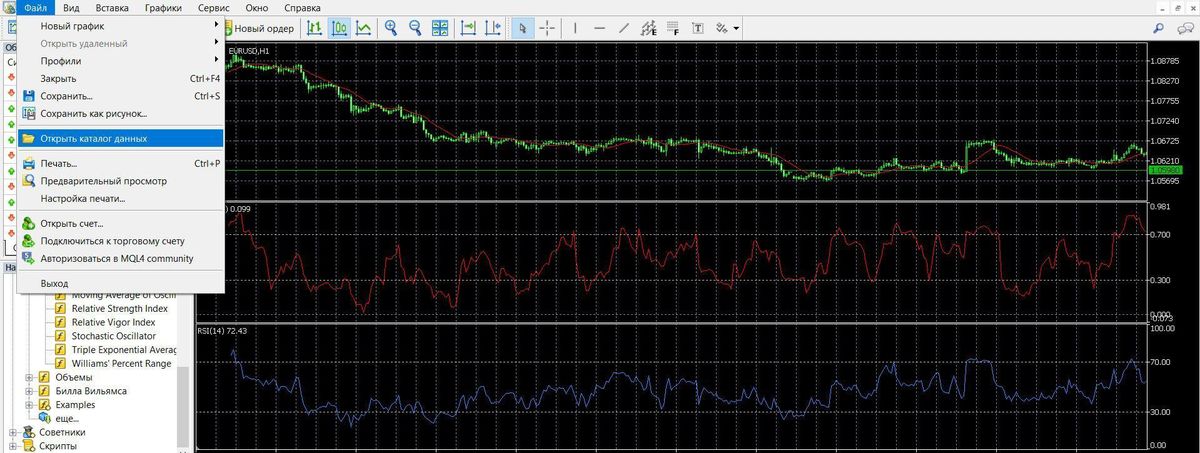
First you need to find the tool file itself and only then you can proceed to install it. If you do not have this file, you can safely and free download it from our website. Then you can continue your work. In MT4 such programs are installed in the data directory, for this purpose go to the menu at the top left and select the button “Open data directory”:
Then, in the opened folder you need to open the folder “MQL4”, then – “Indicators”:
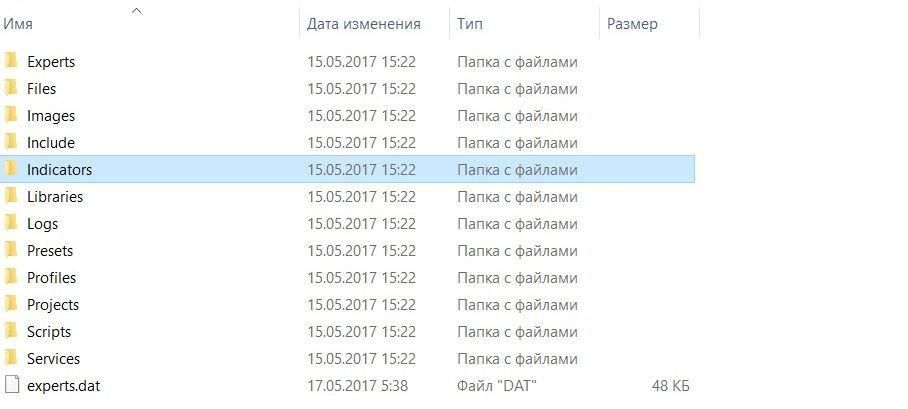
This is where the tools previously installed in the program are contained:
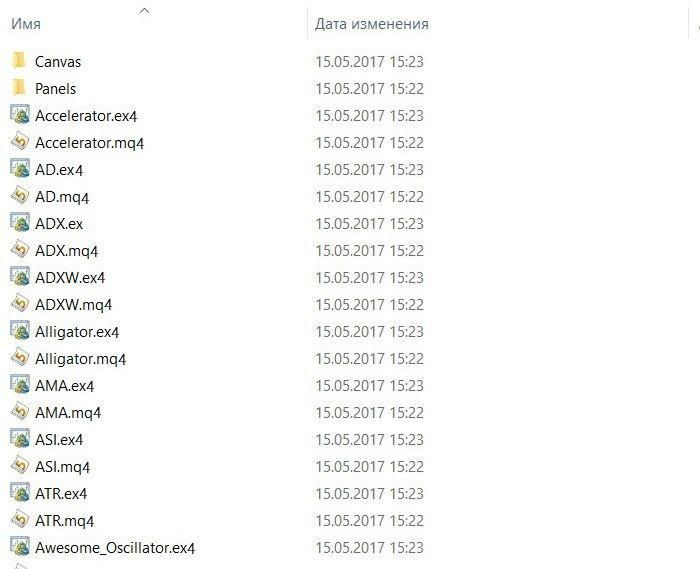
To install the moving average, you only need to copy its file into the folder and that’s it – it is already in the program. Now it remains to restart it (close and open it) and check if the EMA is in the program by going to the “Custom Indicators” folder.
EMA trading signals
Price crosses the EMA line:
- If the price breaks through the moving average, heading upwards at the same time, it is an opportunity to buy the asset.
- If it breaks through the moving average, while heading downward, it is an opportunity to sell.
Intersection of the two EMAs:
Two lines of sliding allows the trader to get a more complete picture and make clear conclusions, guided by this logic:
- When the “fast” moving average crosses the “slow” moving average from the bottom to the top, it is a great opportunity to buy the asset.
- If these lines intersect and move from top to bottom, it is a good opportunity to sell.
EMA signals in MetaTrader 4
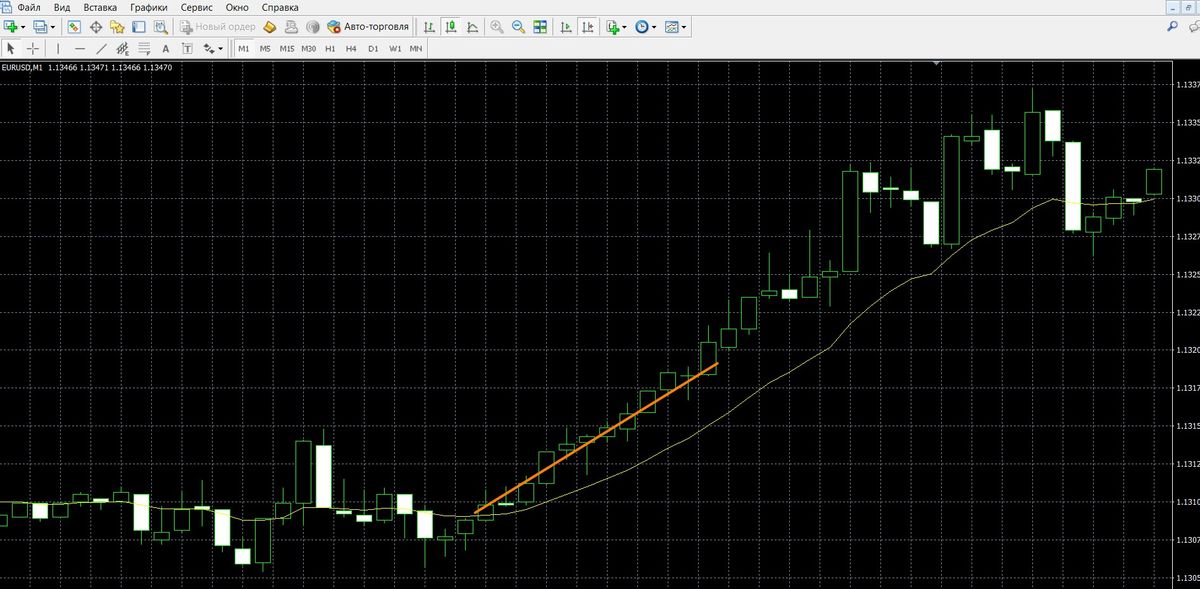
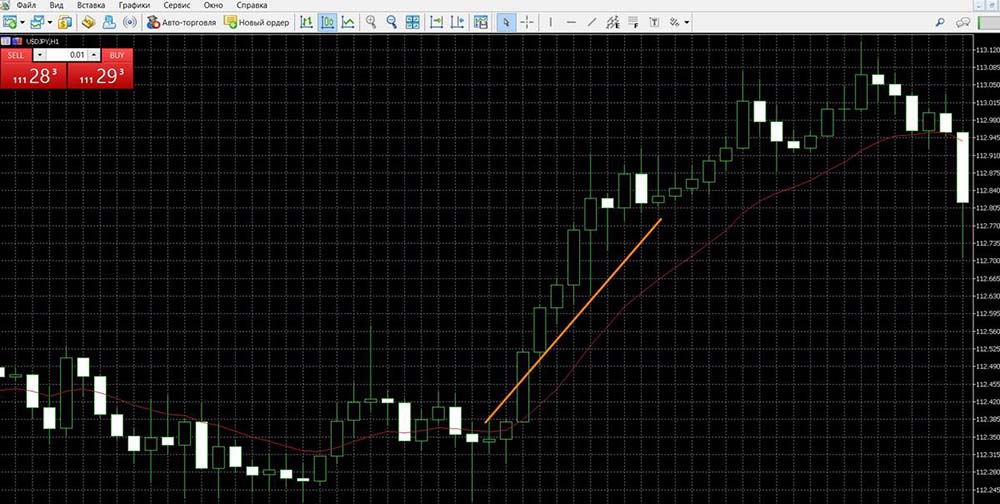
- Price crossing the EMA
If the price breaks through the moving average, heading upwards at the same time, it is an opportunity to buy the asset:
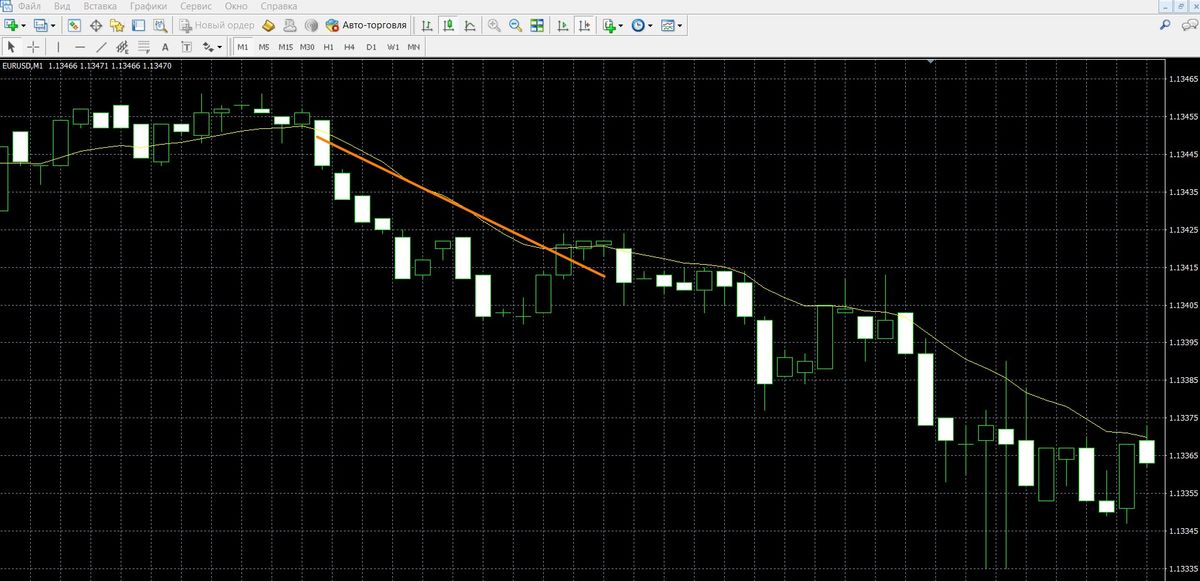
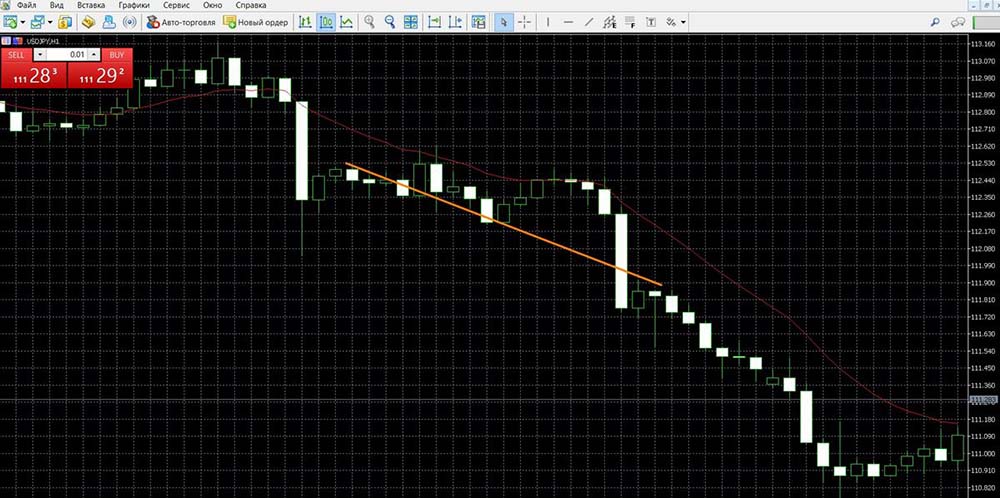
If the price breaks through the moving average heading downward, it is an opportunity to sell:
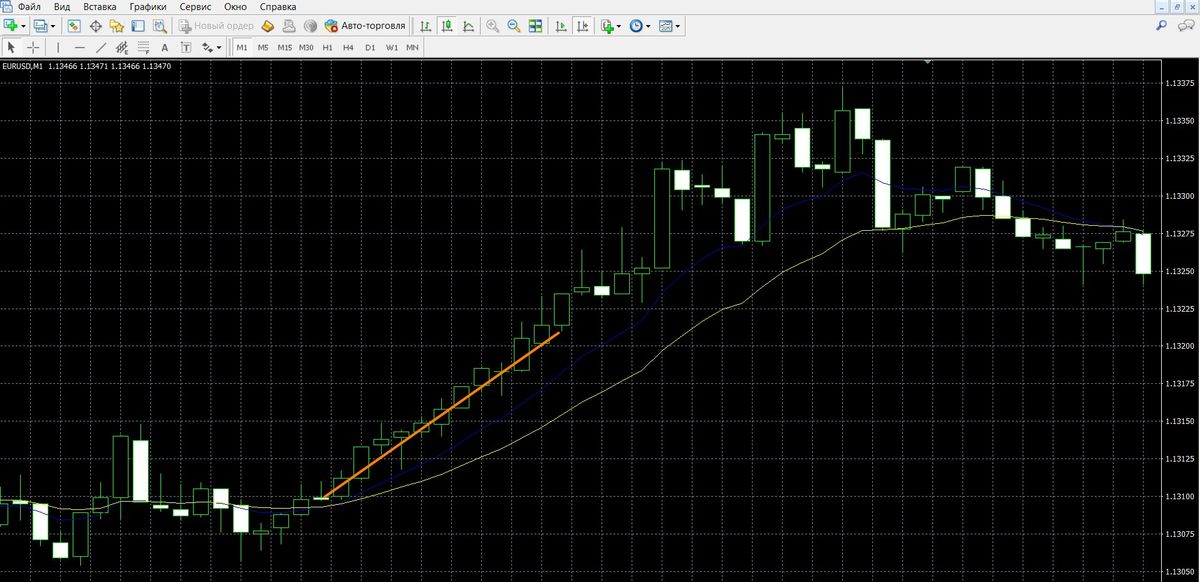
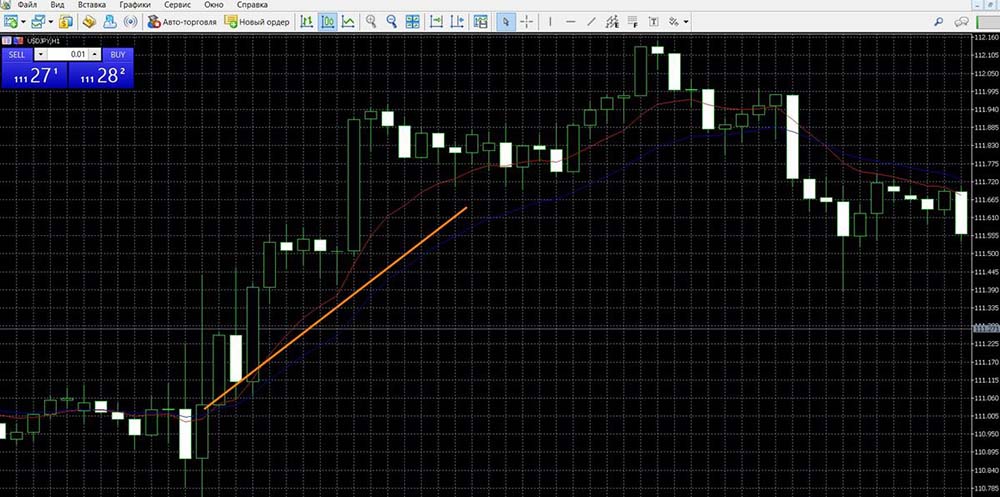
- Intersection of two EMAs
When the “fast” moving line crosses the “slow” line from the bottom upwards, it is an opportunity to buy the asset:
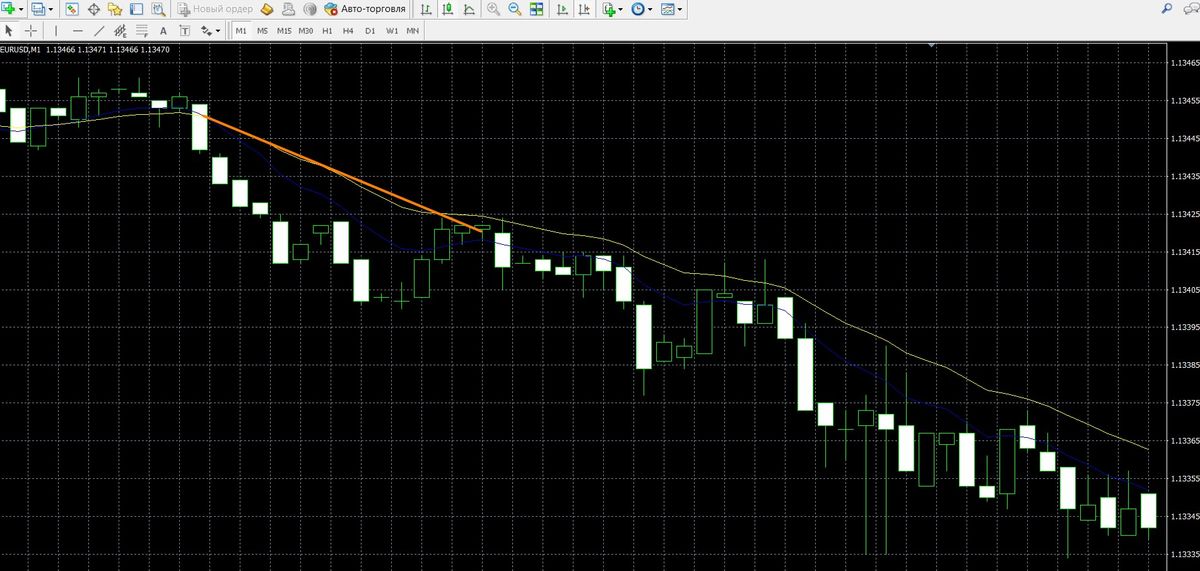
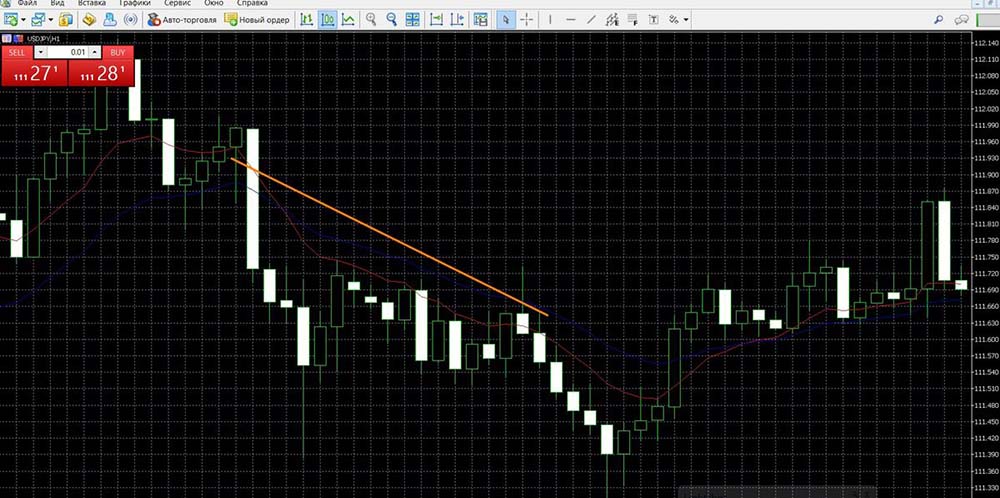
If these lines cross each other from top to bottom, it is an opportunity to sell:
EMA signals in MetaTrader 5
- Price crossing the EMA
Acquisition of an UP contract:
Selling the contract DOWN:
- Intersection of two EMAs
Opening a contract upwards:
Opening the contract DOWN:
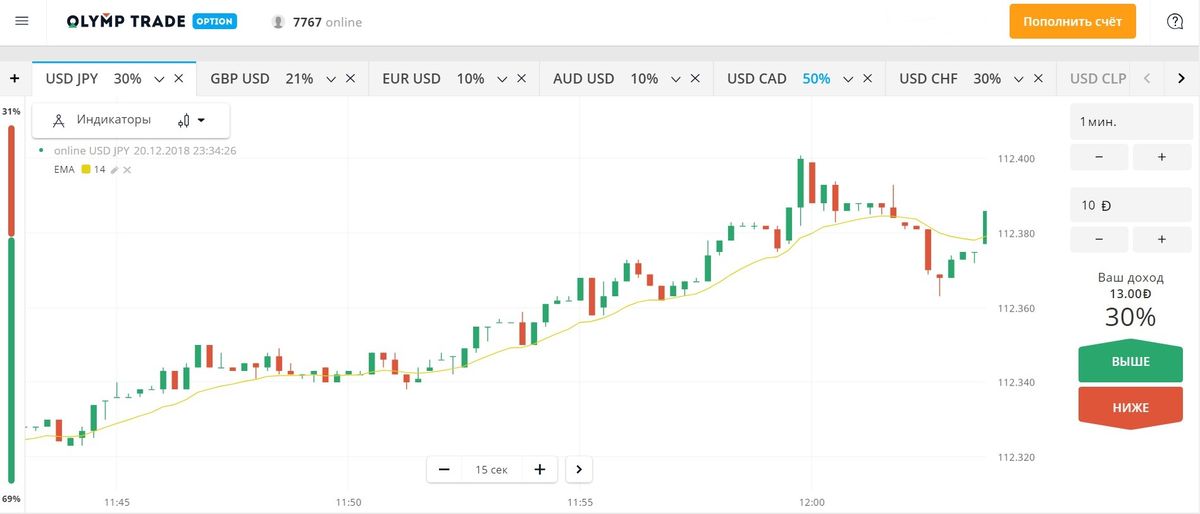
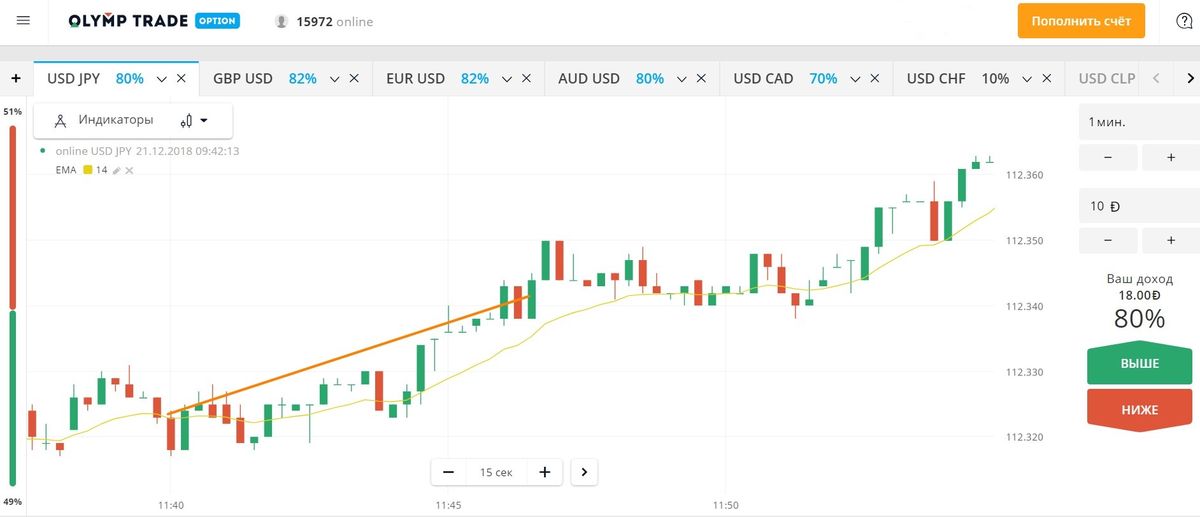
EMA Signals at Olimp Trade
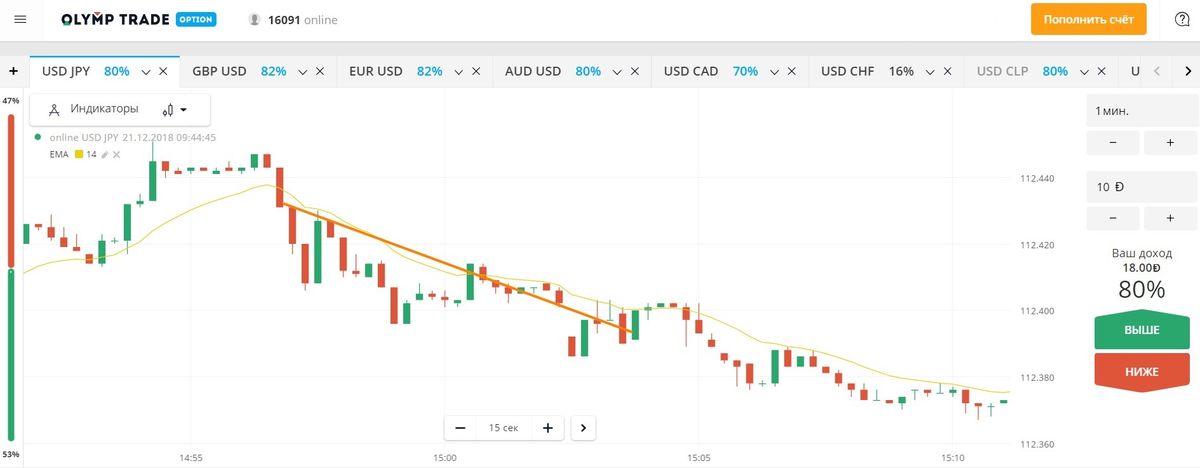
- Price crossing the EMA
Contract Formalization UP:
Contract Formalization DOWNLOAD:
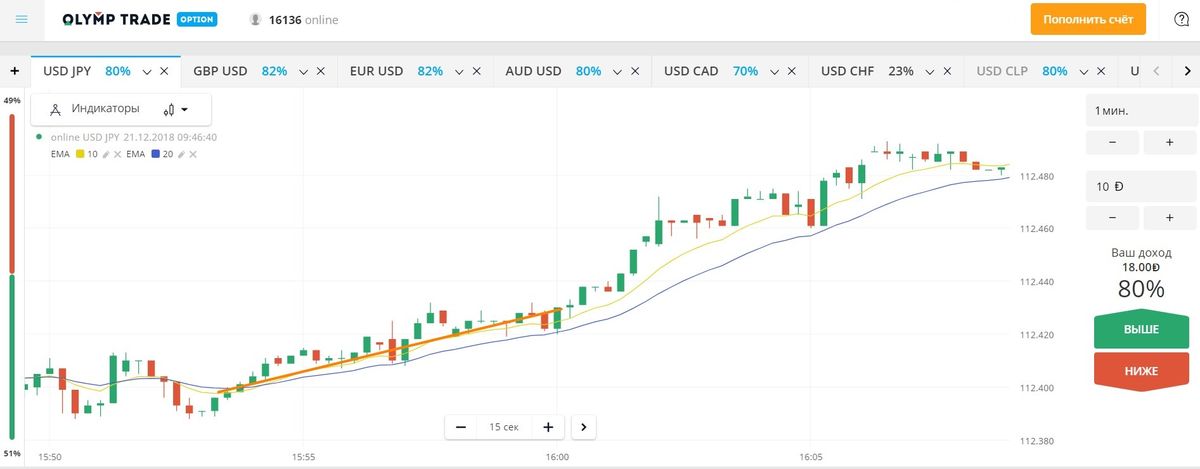
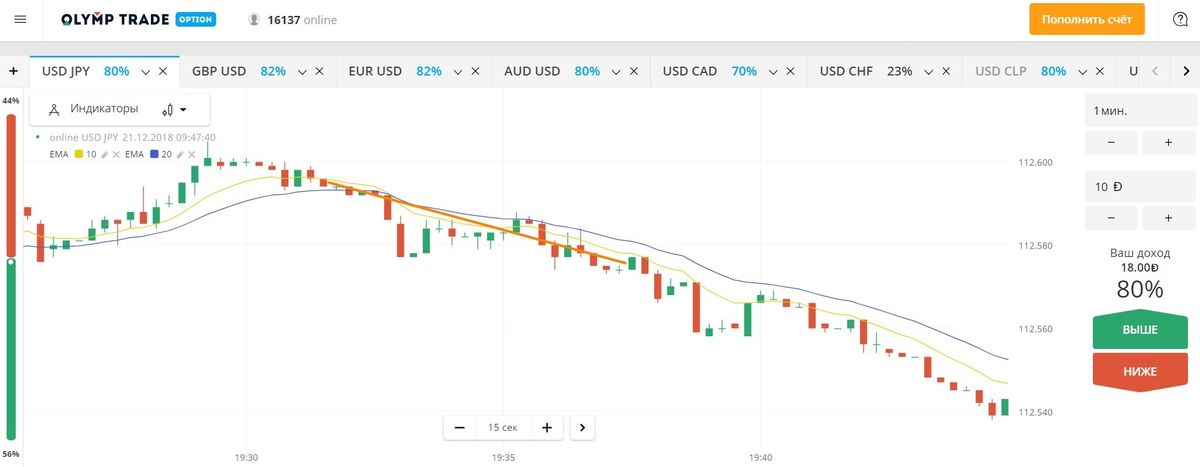
- Intersection of two EMAs
An opportunity to purchase a call option:
An opportunity to purchase a PUT option:
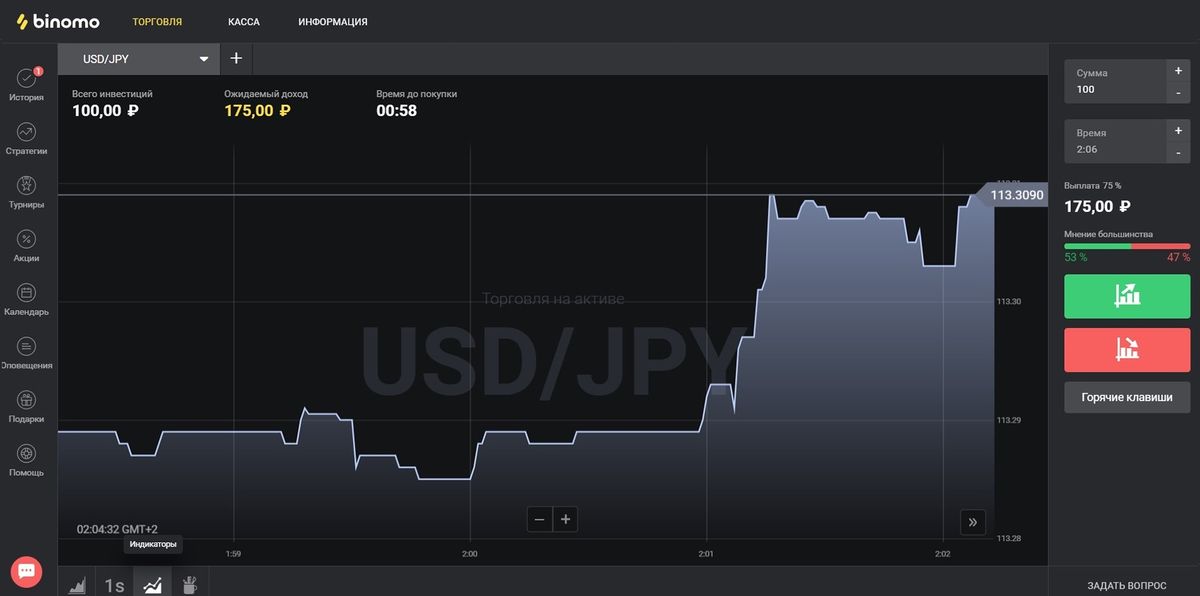
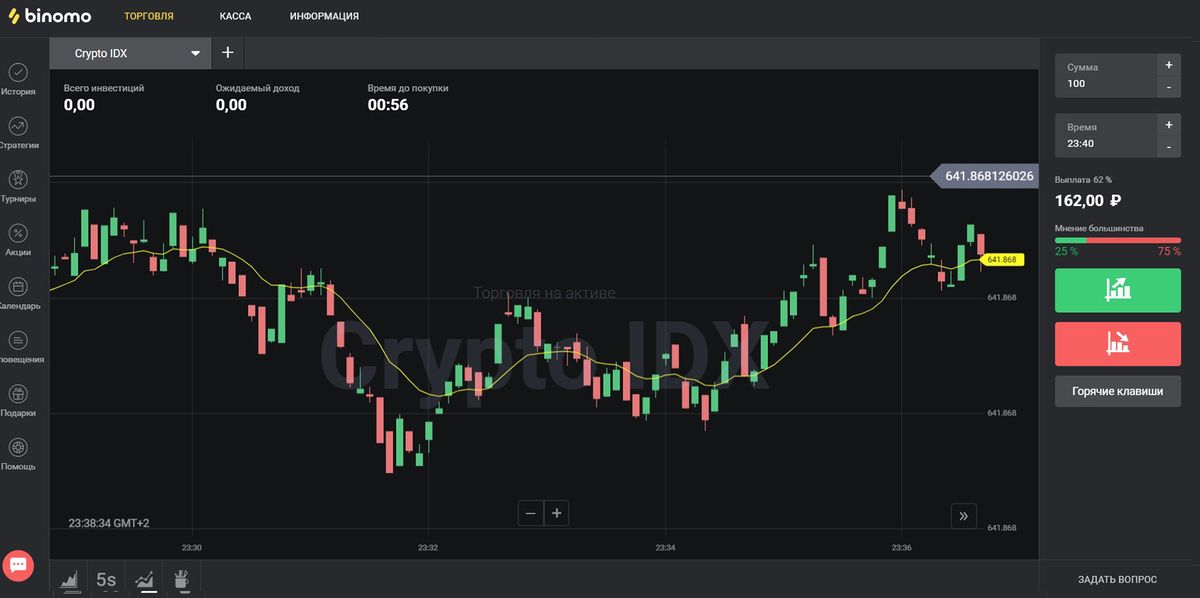
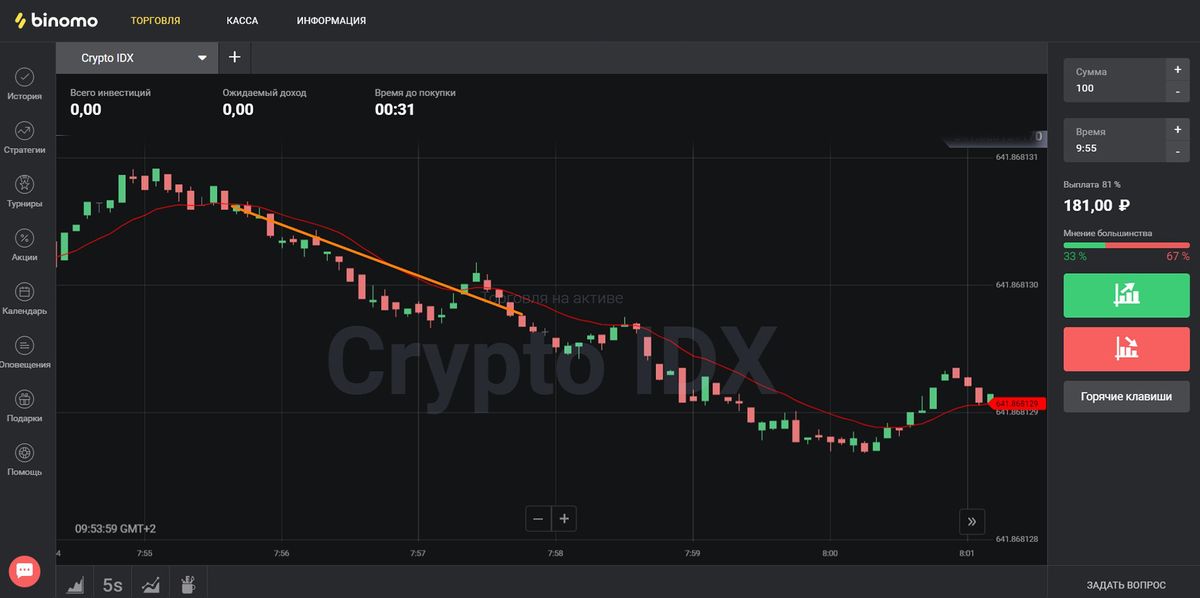
EMA signals in Binomo
- Price crossing the EMA
Implementation of the KOLL contract:
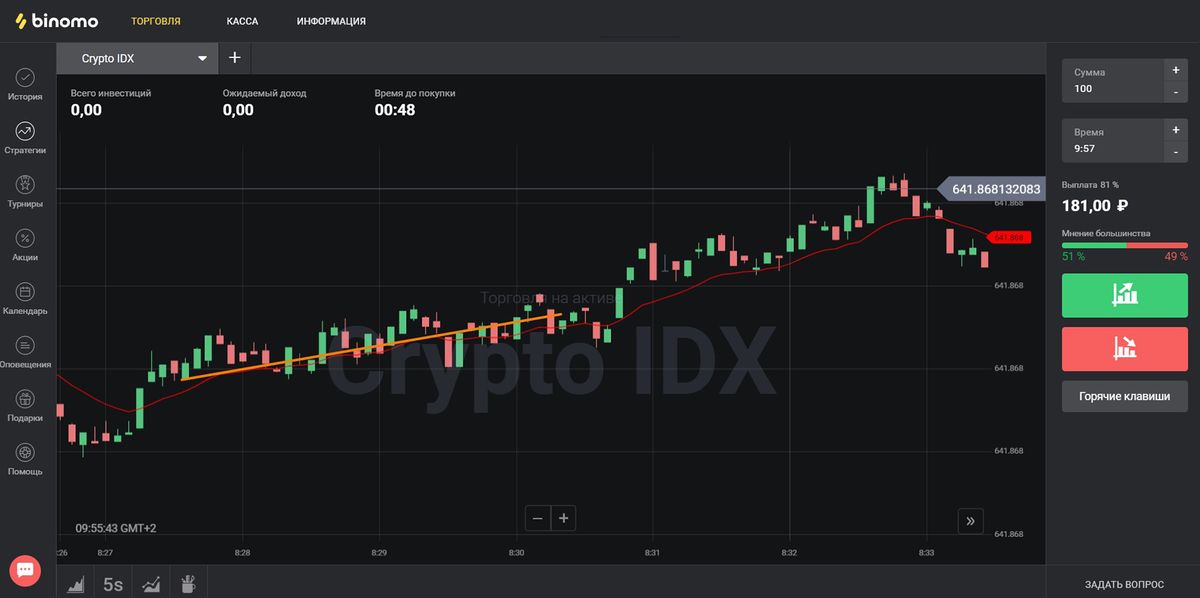
Implementation of the PUT contract:
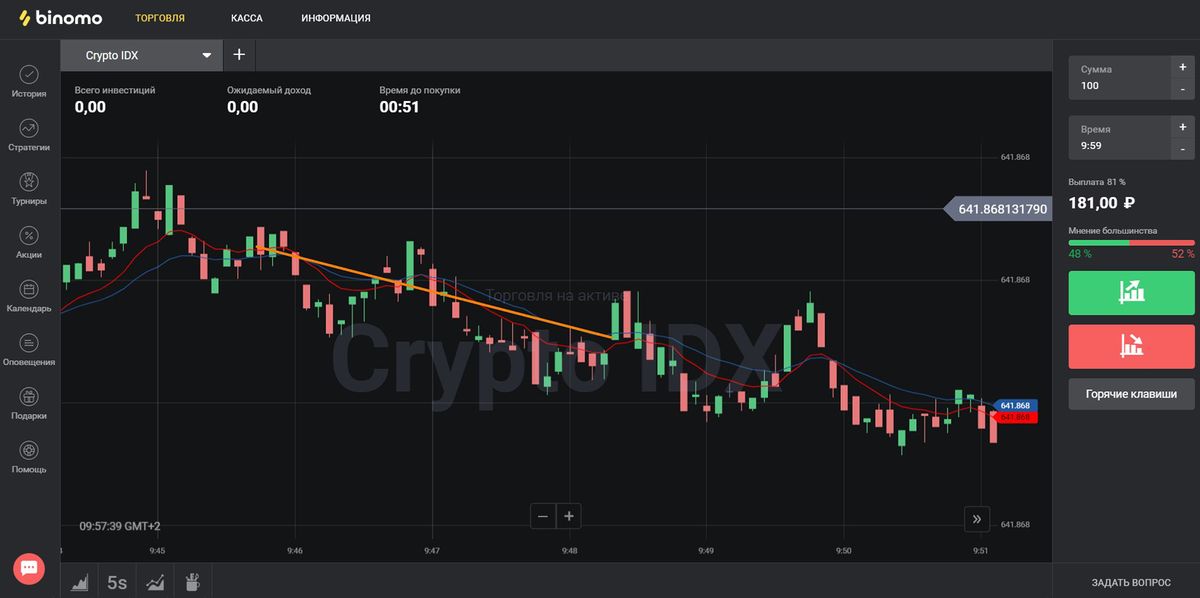
- Intersection of two EMAs
Acquisition of an UP contract:
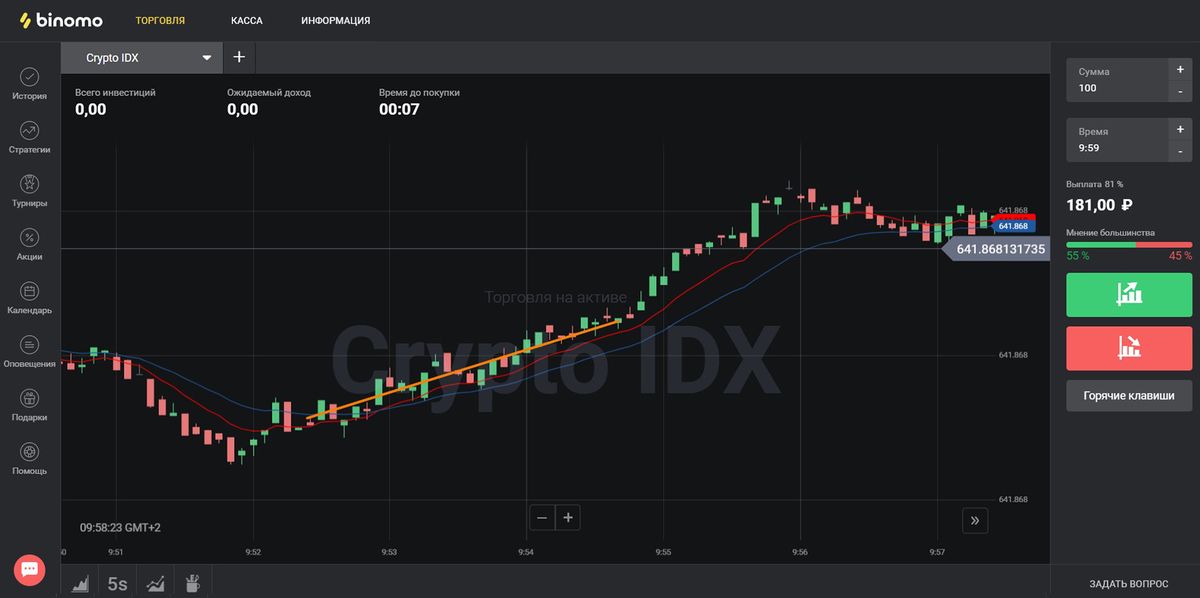
Acquisition of a DOWN contract:
Trading Strategies with EMA
- “Heiken Ashi + EMA”
This is a variant of a decent “people’s” strategy, which was developed and optimized by investors themselves, which means that it has already been tested more than once by experienced players in real market conditions. Its advantages: the possibility of daily work with it, the yield over 87%, simplicity.
It is based on a proven toolkit that will not let the player down in a difficult situation, this EMA, chart type Heiken Ashi, Dodge. Moving Exponential allows to work perfectly with fast contracts and in time to confirm the market sentiment.
To purchase a contract to go up, the following situation should occur: in a downward mood appears doji candle, with the closing of the next candle passes behind the EMA. It is worth entering the position when there is a probability of closing the second candle that appears after the Doji. To buy a contract to go down, the following situation should occur: in a downward market mood appears Doji, while the close of the next candle again passes after the EMA.
The resultant system contains signals at its core CCI (Commodity Channel Index) – oscillatorwhich generates information about the best signals to start trading. The method is based on the use of two variants of this tool (transformed and weighted), and a moving average is used as a filter-helper. CCI with Volume Weighted EMA is a minimally advanced CCI, which, in addition to averaging, also “weighs” the price indicators, instantly reflects trends in volatility and generates accurate signals. Inverse Fisher Transform CCI is also a modification of CCI, which resembles Parabolic SARgenerating the exact points for the trades. Moving Average by Kaufman (KAMA, AMA) allows you to work on the market in any trend: both in the active change of mood of the players, and in a flat.
To trade higher, you must wait for the following picture on the chart: the green candle must break through the KAMA, and both CCIs must enter into overbought zone (at the same time they are located above). To trade down, the instruments must show the following data: the red candle must break through the KAMA, both CCIs enter into an oversold zone (they are located on the bottom).
This is an example of a highly effective method of analyzing quotes, while based on a combination of simple tools. The system is convenient for beginners of the market, will make their work effective, because it generates a lot of accurate signals for investments in futures contracts. The smart combination of tools clearly determines the market mood and the appearance of new trends: Ishimoku EMA Bands is a powerful trading system consisting of Bollinger Bands, EMA and Ishimoku, affecting the quality and result of trades; AO Oscillator, an excellent tool to filter out false data, able to accurately assess the situation; Price Oscillator, assessing medium-term trends. All together, these tools create a strong system that can lead the trader to a positive result.
To trade on the rise the system must generate the following signals: Price Oscillator must indicate the development of an uptrend; at the same time the price breaks through the level of sliding and Ishimoku, heading up, and EMA changes its color to blue; at the same time AO must grow above the zero level. For trading on the downside the system shows the following signals: Price Oscillator shows the appearance of a downtrend; the price breaks through the sliding and Ishimoku, moving down, and the EMA has become red; at the same time AO is located below the zero level.
The highly effective system allows you to accurately determine medium-term trends when working with any asset. This work is based on determining within an hour the probability of trend development and the level of forming a deal with optimal conditions. Such difficult tasks are easily solved here using reliable tools: 8xMA – interesting, but at the same time multifunctional tool that uses 8 sliding bars in its work, capable of easily assessing the market and finding points for trading; Fibline Glance – this service calculates the price channel data, generates accurate signals; Snabbel _RSI_EMA – this oscillator can accurately detect market noise and filter it out to obtain highly accurate signals. Such a system is able to generate accurate market forecasts for good trading results.
To trade on the rise, the technical instruments of the system should have the following indicators: the fast 8xMA lines, as well as the quotes of the asset, moving in the up direction, crossing the slow lines and the narrow Fibline Glance channel; the Snabbel _RSI_EMA lines show the growing upward dynamics with a slight divergence of lines. To trade on the downside, these instruments must have different indicators: the fast 8xMA lines, as well as the quotes of the asset, moving in the downward direction, crossing the slow lines and the narrow Fibline Glance channel; the Snabbel _RSI_EMA lines show the falling downward trend with little line divergence.
This is a simple trading system, which is based on the use of serious tools that show the accuracy of signal generation and good performance when working with 30-minute options. It uses a clever combination of tools that work best with medium-term contracts, but reduce the appearance of noise in the market: it is Pivot Boss 4 EMA, it is needed to find pivot points when forming a new trend; MACDgen is considered the most effective method of filtering false signals; TheLark Volume Momentum (based on the indicator Momentum) is needed here to find the necessary entry points.
To trade on the rise the system elements should show the following situation: the Pivot Boss 4 EMA lines (yellow, blue and gray) break through the red level, moving up; the MACDgen muvings should cross the scale, showing growth; theLark Volume Momentum also shows growth. To trade on the fall the system elements must generate a different situation: the Pivot Boss 4 EMA lines (it is again the yellow, blue and gray coloring muvings) break its red level, moving down to the same; in this case the MACDgen muvings must cross the scale, showing a fall; TheLark Volume Momentum also shows a fall.