The Trend Line on Stock Charts
Contents
What is a trend line?
The trend line (Fig. 1) is one of the main graphical analysis tools for the trader. A trend is a unidirectional price movement that develops over a period of time, and a trend line is a visual representation of the trend direction.
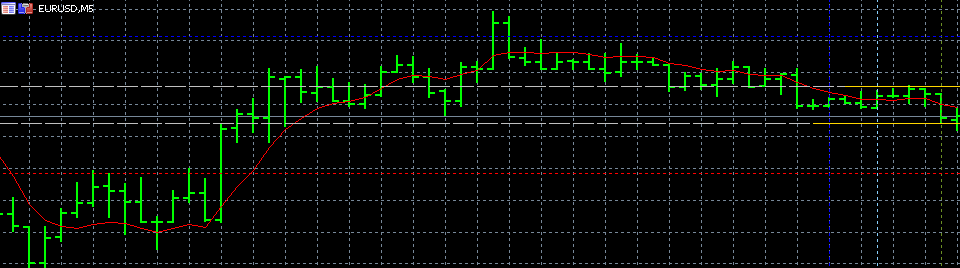
Image. 1
The trend line allows you to determine whether there is a trend at all and what kind of trend it is – upward, downward or flat (sideways movement with minimal fluctuations).
For the trend line to be informative, it is necessary to choose correctly the points through which it will be drawn. The correctness of the construction is checked with the help of additional indicators.
The trend is plotted from right to left, as the right side of the chart shows current prices and the left side shows old price values. Even if the price is plotted correctly, it is important to be able to interpret the information correctly.
The most important thing in the analysis of the trend line is the ability to determine the signs of a change in the trend, because it allows you to find profitable entry or exit points from the trade.
What are the trends?
Trends can be classified by time and direction.
As a rule, by time they distinguish a long-term trend, lasting a year or more – this trend is needed mainly for investors.
The medium-term trend lasts from one month to six months and it is of interest to all traders.
The short-term trend lasts from a week to a month, it is the most important for traders, many strategies are built on the fluctuations within this trend.
But the duration of the trend depends on the timeframe, on the hour chart long-term trend lasts about a week, medium-term trend – 1-2 days, short-term – from one hour to one day. On shorter timeframes the trend can also be identified (Fig. 2).
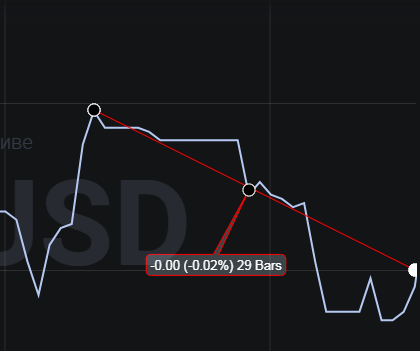
Image. 2
There are three stages within a trend – accumulation, development and completion. At the accumulation stage, which looks like a flat on the line, traders actively buy or sell assets, setting the direction of the trend. At the development stage the trend moves in the formed direction. At the final stage the price of the asset reaches the maximum or minimum value and a deep correction begins, which leads to a change in the trend.
Trend lines can be upward, downward, or sideways.
An uptrend demonstrates a steady increase in demand for the asset and the dominance of buyers in the market. On the chart, this trend is shown as a line that rises upward, each new price maximum and minimum on the chart is set higher than the previous one.
The downtrend shows the dominance of sellers in the market, on the chart it looks like a line directed downward, each new high and low of the price is located below the previous.
A sideways movement shows that supply and demand are balanced, the forces of buyers and sellers are about equal and no one can get the upper hand. On the chart, it looks like a fairly long line with minor fluctuations in price values.
The trend line is determined by the trader himself or with the help of indicators. When finding a trend line independently, traders first determine the timeframe and select the point from which the trend line will be set and mark the points of minimums and maximums.
Despite its apparent simplicity, determining a trend line on your own requires skill.
In addition, now in most cases, this is not necessary, because there are many indicators on the trading floors, which allow you to determine the trend line automatically.
How to interpret the information of the trend line?
When studying the development of long-term trends, traders evaluate the dynamics of the trend as a whole. Directly during trading, the main thing is to determine the breakdowns – points of trend change.
First of all, it is necessary to make sure that the trend line is true. If the line is drawn only on two extrema, it is a tentative line, it should be confirmed by the third price value (Fig. 3) in the same direction. This means that a stable trend has been formed and trading can begin.
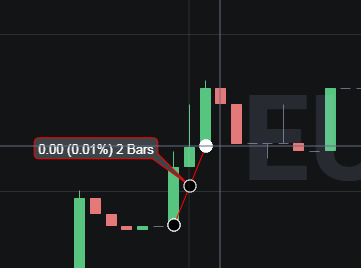
Image. 3
A breakout, which looks like a significant rise or fall in the price of an asset, most likely shows that the trend has reversed. Breakout lines can be false, because price can reach reversal values during the day, but quickly go back. Therefore, trend line information is confirmed or refuted with additional tools and indicators – the behavior of candlesticks or bars, identification of graphical figures, and so on.
The breakout also allows you to predict prices, it is believed that after the breakout, the price of the asset will rise or fall by the same distance that it went before the breakout. If the price was falling $50, then after the breakdown, from the breakdown point, it will rise by $50.
What is important when analyzing a trend line is the slope angle. The steeper the slope angle of the trend line, the less stable the trend is. When trading on the trading floor it is necessary to keep in mind that on the computer monitor, when increasing or decreasing the chart scale, the trend angle changes as well. Therefore it is necessary to assess the angle not visually, but by the relative increase or decrease in price.
If, for example, the price rose sharply in a short period of time, it is hardly a sustainable trend.
Gentle angles, as a rule, do not change for a long time, such an angle shows the stability of the trend.
What does the trend depend on?
A trend is formed under the influence of some news, real or supposed. Some market participants may have an important insight, start buying or selling assets in large volumes, other traders follow them and a trend is formed. Also, a trend can be formed under the influence of important events in the economy – increase or decrease of the bank rate, positive or negative economic report, important events in the corporate world.
The trend is formed with the opening of long positions by large players who rely on some important information. The balance of supply and demand changes, it is reflected in the information of technical indicators and under its influence other market participants begin to open positions. This is how the first stage of the trend is formed.
Then more and more players join the trades, the trend is finally formed and strengthened by speculators, after which the most cautious or inexperienced players join the general movement, but it happens closer to the end of the trend.
A trend ends when supply and demand are balanced and no one dominates the market, neither buyers nor sellers. As a rule, before the end of a trend, strong short-term fluctuations in the price of an asset are noticeable, often in the opposite direction to the trend.
Trend lines in binary options trading
The trend line (Fig. 5) on the platforms by binary options trading is included in the standard set of indicators (Fig. 4). The trend line is the basis of many trading strategies binary options. Among them is the strategy of trading on two trend lines – the main and correction lines. The essence of trading in determining the corrective trend within the main trend.
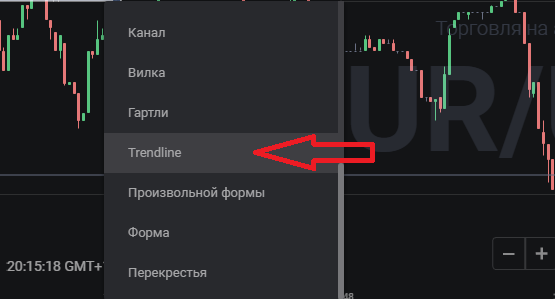
Image 4
Within the strategy, the main trend line is drawn on the highs on a downtrend and on the lows on an uptrend. Once the trend line is determined, the trader waits for a correction. When an upward correction appears on the downtrend line, a Put option is purchased.
On an uptrend, too, a short-term upward correction is expected after a downward move in the main trend, but a Call option is purchased.
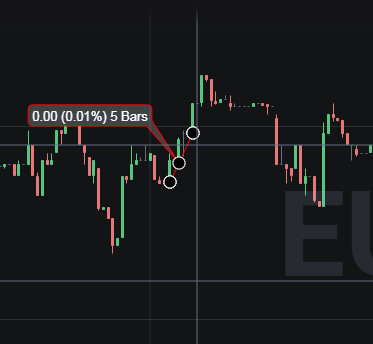
Image. 5
It is optimal to implement the strategy on candlestick chart on short timeframes, because it most accurately determines the short-term corrective trend and its duration. During the main trend, the trader can conclude, in principle, any number of trades using this strategy.
Trend lines in the forex market
At forex trading platforms In the list of basic indicators (Fig. 7) there is a whole series of trend indicators (Fig. 6). You only need to decide which ones you need to work with.
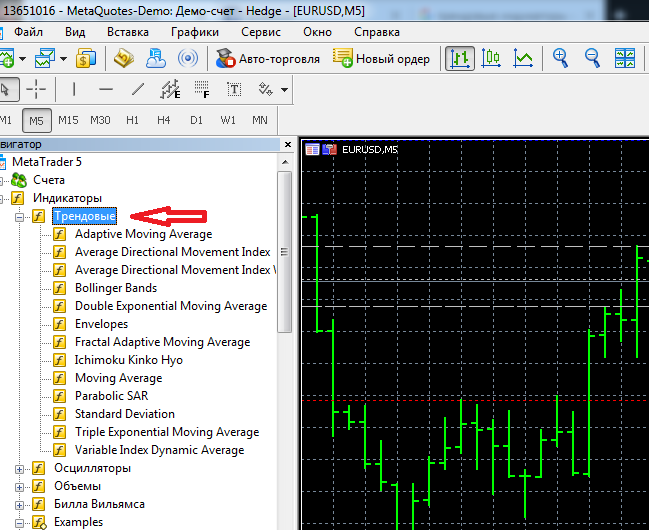
Image 6
At forex market The trend line is also used in various strategies. One such non-syndicator strategy draws a line on two lows in an uptrend.
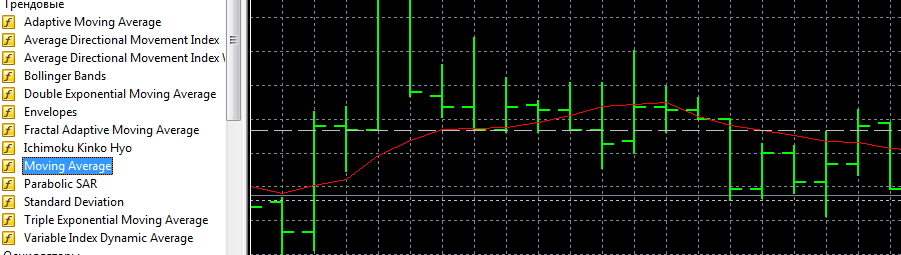
Image 7
Then the price is expected to rebound from the second point to the local maximum, after which the price will return to the trend line, near which a buy order is set. After reaching the trend line the price rises again.
The downtrend is carried out on two highs. In this case it is necessary to trace when the price from the second of the marked maximums goes down, before the formation of a local minimum. When the price starts to rise to the main trend line, a sell order is placed near it. The price, having reached a local maximum, continues to fall.
Trend lines in cryptocurrency trading
Strategies cryptocurrency trading trend lines are popular because price fluctuations in the crypto market are significant in short time intervals. Trend lines, as a rule, are initially superimposed on the base chart (Fig.8).
Cryptocurrency trading strategies do not differ from similar strategies on binary options and forex.
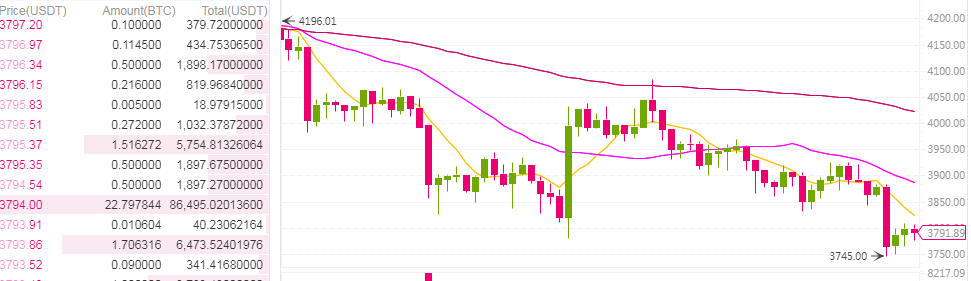
Image 8
When a long stable trend develops, a flat, traders predict moments of breakdown of the main trend, corrective movements, rebounds, and so on.
The trend line becomes especially important when the price of a cryptocurrency is rising strongly. Then trading is simplified to placing orders in accordance with the movement of the trend, so as not to buy at the highs, but the general excitement and leads to a lot of such purchases.
This kind of trade is complicated by the fact that in the crypto market, no one knows when the price will stop rising, because the patterns of pricing of cryptocurrencies are unknown.
A prolonged uptrend in the cryptocurrency market is followed by an abrupt, unpredictable downtrend. At a certain point, the fear of losing money reaches such a level that traders begin to dump assets en masse in order not to sell at the low – what it will be, at what price the price will stop, is unknown. You can see it on the chart as an almost steeply declining trend line.
Conclusions
The trend line is the basis of trading any kind of exchange assets, the basis of technical analysis, without the ability to accurately determine it trade will not be effective. Trading lines are the most convenient tool for assessing long-term trends in any market. And numerous trading strategies are based on trend lines for any assets at any timeframe.