Support and Resistance Levels
Contents
- 1 How to determine support and resistance levels
- 2 How to use support and resistance levels
- 3 Support and resistance level indicators for mt4 and mt5
- 4 Support and resistance levels in binary options trading
- 5 Support and resistance levels in forex trading
- 6 Support and resistance levels in cryptocurrency trading
- 7 Conclusions
How to determine support and resistance levels
Resistance and support levels are the basis of technical analysis. Prices move in a wave-like manner and periodically hit certain highs or lows, from which the price reverses or crosses them when the trend changes (Image. 1).
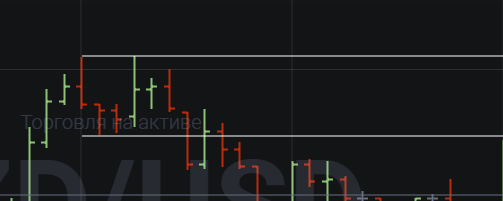
Image. 1
Support is the level that supports the price, that is, prevents it from falling lower. Resistance is the line that keeps the price from rising, resisting its rise.
Depending on price dynamics, the resistance line can become a support line and the support line can become a resistance line.
Support lines are drawn on two or more lows, resistance lines are drawn on two or more highs.
Touching the price point of an extremum on the chart allows you to start drawing the line, the second extremum allows you to draw a line of support or resistance completely (Image. 2). Extremes rarely repeat, so if the difference between them is insignificant, the line is drawn approximately in the middle between them. If the difference between the marked extrema is large, the price range between these points is identified for the line and traders are guided by it when drawing lines.
It is easier to identify resistance and support lines in a sideways trend, in a flat. With strong price fluctuations, the probability of mistakenly identifying support and resistance lines is very high.
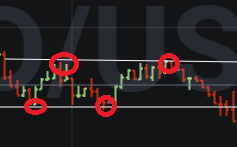
Image. 2
Resistance and support lines can be strong and weak. The strength is determined by the length of the timeframe and the number of price touches of the line. The longer the timeframe, the more touches, the stronger the resistance or support line is considered. More important than the number of touches is the length of the timeframe.
Correct support and resistance levels
Strange as it may seem, there is no settled opinion about what support and resistance levels are correct, nor are there clear, unambiguous definitions of the relationship between extremums and lines. Nevertheless, most traders believe that resistance and support levels are horizontal lines drawn at maximum and minimum price values.
It is believed that in an uptrend, resistance levels are formed at the highs of impulse movements and supports are formed at the lows of corrective movements. The next low coincides with the next high and, accordingly, turns the resistance level into a support level. On a downtrend, the maximum coincides with the previous minimum, and the support level turns into a resistance level.
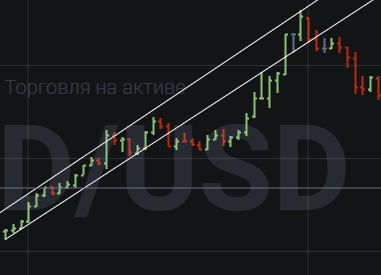
Image. 3
There are traders who believe that the support and resistance lines can be oblique (Image. 3), drawn through the highs and lows, in fact, they are trend lines.
Also support and resistance lines can be drawn through the reference price points of supply, TD-points, – these are extrema surrounded by lesser extrema. The maximum point is the one above which prices have not been for a certain period of time, and the minimum point is the one below which prices have not been for a certain period of time.
Over time, each trader determines for himself which is the best way to draw the support and resistance lines for his purposes. Some traders are limited to determining lines that are close to round values, that is, that end in zero.
The method of finding resistance and support levels by previously formed reversal levels is also used. It is assumed that if the price bounced from a certain level, it will bounce from that level again. In this case, the trader should carefully analyze the price dynamics and draw the lines manually.
Each method can allow the correct identification of support and resistance levels or can lead to errors – it depends only on the skills of the trader.
How to use support and resistance levels
There are many methods of working with support and resistance levels. Although there is a great deal of educational information on this subject on the Internet, learning how to use support and resistance levels can only be achieved through practice.
First of all, it is trading on a bounce and breakout. This method assumes that if price meets strong support or resistance, a price reversal is likely to occur. If the trend is strong, then price can cross any level and advance further. This method involves opening trades only in the direction of the trend (Image 4).
Trading on support and resistance levels can be done in a horizontal price channel. In this case transactions are made when the price approaches the upper border of the channel, counting on the resistance line crossing or on the rebound and fall of the price. It is not the price points, but price support and resistance zones that are taken into consideration to a greater extent. Which trend will prevail should be determined by additional indicators on the chart – the behavior of bars, candlesticks, and so on.
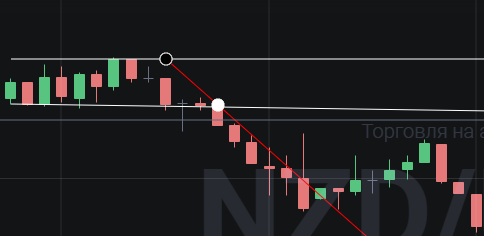
Image. 4
Support and resistance level indicators for mt4 and mt5
For the mt4 and mt5 trading platforms there are many indicators of support and resistance lines – signal, statistical, based on historical extremums and others. They need to be downloaded from the Internet, unzipped and uploaded to the trading platform through the appropriate service.
One of the signal indicators are Level Stop-Reverse and ATR Levels, which show the points of possible price reversal.
The Power Dynamite indicator is based on the statistical analysis of highs and lows. It allows tracing extremums by frequency, by their influence on the trend, psychologically significant marks without taking into account trader’s subjective preferences and his emotional state.
The Happs Phases indicator is an indicator for determining support and resistance lines in real time based on information from moving average tools, average data, regressions, outliers and others.
Using historical data, lines are determined using the Access Panel indicator.
And there are indicators that work on theories, particularly on Fibonacci numbers, Gunn squares, to fractals Williams and others. These include Support and Resistance, Gamm Resistance, Murray Math Bock, and several others.
The Beginner indicator for MT4 and MT5, which shows extremums, is used to build lines. TradeBreakOut indicator for MT4 and MT5 (Image. 5, 6) shows the breakdown of local support and resistance levels.
For the MT5 platform there is an indicator such as Lrma (Linear Regression MA). It uses a moving average and can be used to determine dynamic support and resistance levels.
Image. 5
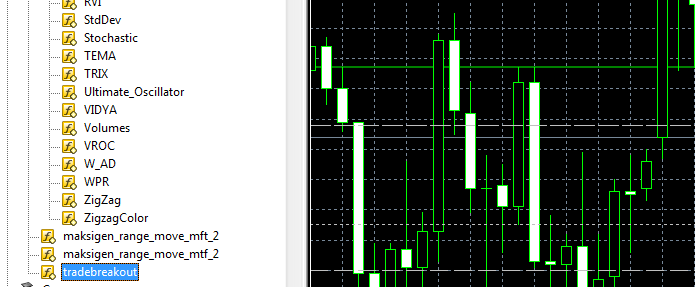
Image. 6
Support and resistance levels in binary options trading
Resistance and support levels are actively used in binary options trading. One strategy is to trade in the price channel in the main price zones on the rebound.
First, a channel is defined, for which more than 2 extrema are marked on the chart.
After that the outermost support and outermost resistance zones are defined, the timeframe up to M15 is chosen. Four points of extremum indicate three waves (Image. 7).
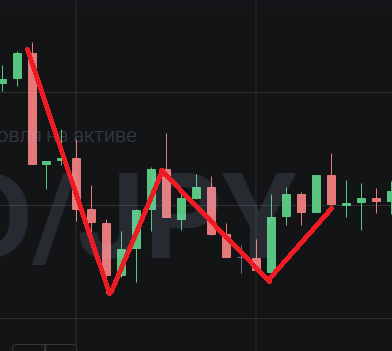
Image. 8
After that, the approximate level of expiration from the first extremum point to the last one is determined. If trades are conducted on a candlestick chart, then it is necessary to add up the number of candlesticks and divide by three (the number of waves). This will determine where on the chart to make the trade.
After the price has touched the lower boundary of a certain channel, you can open a Call option with a previously defined Expiracy. Trades in this strategy can be executed more than once, focusing on the price touching the support level. Put options are opened on the rebound of the resistance line with the same expiration time.
Support and resistance levels in forex trading
In the forex market Strategies based on support and resistance lines can be considered basic. In particular, trading within the price corridor when prices rebound – buying on a rebound from the upper boundary and buying when approaching the lower boundary. In this case stop-losses are applied above or below the boundaries.
Trading on the lines is effective on clearly defined trends. For example, on a downtrend you should follow the upward correction to the previous support level and the new resistance level. On an uptrend, the correction to the previous resistance level and the new support level should be monitored.
_
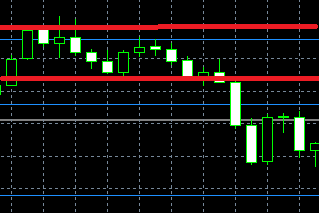
Trading on the breakdown is one of the most popular strategies on the forex market. For its implementation it is necessary to determine the support and resistance levels as precisely as possible. In this strategy, pending buy or sell orders are placed slightly above the resistance level or slightly below the support level (Figure 8).
Support and resistance levels in cryptocurrency trading
Cryptocurrency trading (Image. 9) with the help of support and resistance lines is difficult in periods of high volatility and rapid development of an uptrend or downtrend.
The main strategies are two – a breakout level and a reversal from support and resistance levels.
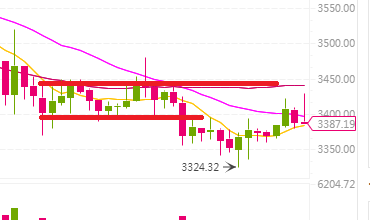
Image. 9
The strategy of trading cryptocurrencies on the breakout differs from other assets and consists in the fact that when trading cryptocurrencies there are too many false signals. Therefore, when implementing this strategy, most trades will be unprofitable. If the trend is clear, the percentage of successful trades increases.
Cryptocurrency trading strategy on the reversal of support and resistance levels is effective on the flat, when the price of coins fluctuates slightly over a long period.
Conclusions
Support and resistance levels are important when trading any asset. The main difficulty in doing so is knowing how to correctly identify levels and place lines. This is a practical skill, since there is no one-size-fits-all definition of how to accurately identify support and resistance lines. The task of finding levels is somewhat facilitated by the fact that there are many indicators on trading platforms to determine them. Many trading strategies are based on support and resistance lines, the effectiveness of which, by the way, also depends on the trader’s practical skills.