Forex Technical Analysis – Trends, Charts, Indicators
Technical analysis is the main method of trading on Forex market. With the help of technical analysis traders are trying to predict the value of the traded asset and, having made a correct prediction, to fix a profit from the price movement.
Contents
Technical analysis content
Forex technical analysis tools include the price chart, graphical patterns, technical indicators and oscillators and so on. The essence of technical analysis is that it is believed that everything that affects the value – is already laid down in the graph of the behavior of the value. That is, the price – is the result of the influence of all factors on it, so to predict its future price movement, it is enough to carefully analyze it. Thus, the theory of the fundamentals of the Forex trading It says that you don’t need to know the news, the state of the company or the economy of the whole country, only the behavior of the price is important.
Top 3 best forex brokers: test their terminals
| Broker | Bonuses | Open an account |
|---|---|---|
|
1
|
50 %
Bonus on deposit from $100 USD – promo code WELCOME50
|
Start |
|
2
|
From 25 To 60 %
Deposit increase for the first deposit
|
Start |
|
3
|
Cashback
Refunds of commissions, spreads and other costs
|
Start |
|
4
|
100 USD
Loyalty program remuneration
|
Start |
|
5
|
20 %
Bonus and cashback by promo code revieweek23
|
Start |
The key law of forex technical analysis is formulated as “history repeats itself”, that is, the behavior of the value is cyclic, fluctuations are repeated over time. And this property can be used in market forecasting. On the real forex currency market everything is not so simple, and traders do not limit themselves to tehanalysis, they have to follow the news fund. Technical analysis is applicable to all the assets on the market, currency pairs, stocks, indices, futures, commodity prices, industry markets, global markets and so on (The whole truth about forex).
Trend
The basic concept of Forex market thechanalysis (Fig. 1) is the trend, which is the direction of an asset’s value movement that is displayed on the chart. Traders make money on the trend and all or almost all Forex strategies. When it points up, it indicates that the price is rising; when it points down, it indicates that the price is falling. The price can move in a sideways direction, a flat, it is characterized by minimal fluctuations (Forex Trading Training).
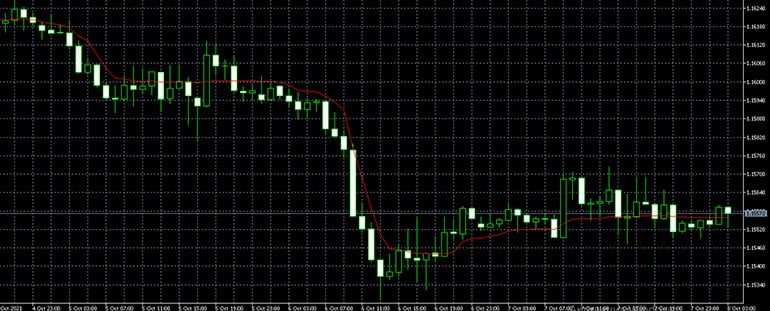
Image. 1
A rectilinear movement does not last long, the price movement is oscillatory, wave-like. The oscillations are irregular and this makes the price unpredictable to the full extent. The whole arsenal of technical analysis tools is aimed at predicting the oscillations at least for a certain period. In a trend there is a beginning, a trend phase, a correction phase, and the end (reversal). The beginning can be both a rise in value and its fall.
Traders strive to predict the beginning and the reversal – if they manage to keep the trade exactly in this direction, the profit will be the most possible. It is important for traders to fix the price at the level of breakdown of the line – that is, at the moment when the direction of movement sharply changes. Seeing the breakdown and fixing the result in time is one of the most difficult things to do in theanalysis, because there are false breaks, strong corrections (when the price returns to after the deviation) and other phenomena that make it difficult to make an accurate prediction.
In tehanalysis, it is believed that price movements in the forex market are accompanied by a certain mass behavior of traders. The time of trend formation is the accumulation phase, and many people miss this moment. After the accumulation phase follows the phase of market stabilization – by this time, experienced traders have decided on the direction of the trend and are already preparing to fix profits and exit the market.
At the beginning of the last phase, as considered in the technical analysis, the inexperienced players in the Forex market, who follow the crowd, and there are many of them, they enter a rising market, but when the movement is already completed, there is a rush in the market, on which the experienced traders earn – and they also fix in time and leave the market with a profit, and inexperienced traders with a loss.
The concept of a trend in the analysis implies the ability to see and build lines – support and resistance levels, which form a conditional channel, within which the price moves. An uptrend is built as a support line by consecutively increasing minimums – the minimum values of the price (extremums). The resistance line is constructed by the value maximums.
The resistance line on the downtrend (Fig. 2) is built by successively decreasing maxima, maximal values of the value. The support line is built by value minimums. Flat, sideways movement, is built by horizontal or almost horizontal support and resistance levels by maxima and minima.
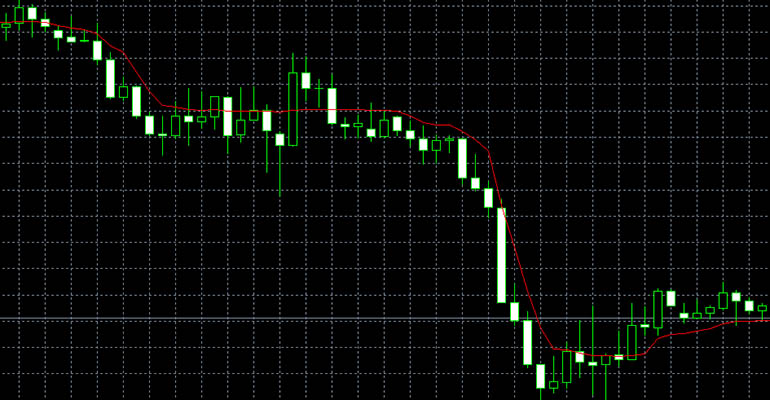
Image. 2
Technical analysis builds trading strategies in the Forex market based only on trend movements. Formally, the strategy is very simple – you need to notice the beginning, determine the optimal entry point, open a deal, determine the optimal exit point, close the deal, fixing the profit and leave the market. A more complex, also a classic strategy, on the rising line involves opening positions to buy on a bounce in value from the support line and close near the resistance line.
On a downtrend, a sell trade opens on a rebound from the resistance line and closes near the support line. Despite the fact that these strategies do not look complicated, but for many reasons, few people use them in their pure form, without additional tools. The difficulty is that you need to have really good technical market analysis skills. That said, without any additional tools, the trader has to be constantly focused on the trading process.
It is difficult to determine the truly optimal entry points into a position and even more difficult to determine the exit points. Trading involves setting loss limiters (stop-loss) – the trader determines the value at which the trade will be automatically closed, without skills, without additional financial tools, it is extremely difficult to determine at what level to put the limiter. From a psychological point of view this is also a difficult method, because you need to be attentive, to be able to resist emotions at losses, which are almost inevitable, and to continue to analyze calmly the situation on the market. In technical analysis handbooks, which are very numerous, it is said that there should be indicators of volumes on the charts. But these parameters are important for the stock markets, indexes and futures. In the Forex trading terminals volumes are not usually shown on the currency pairs, because it is an extra-banking market and no one monitors the volumes of the Forex market as a whole.
Graphs
The chart is the key concept of thechanalysis. In the Forex market it can be seen in any trading terminal. At the heart of any chart is the vertical axis on which price values are plotted and the horizontal axis – the time values. The time axis, which is also called the interval, trading period and timeframe can be for a period of 1 minute and a year and beyond, if necessary. Also on the time axis, ticks can be designated. This is a single quote, a change in the form of two new buy and sell prices. The forex price chart is formed in a specific time period, mainly by four values:
- open – opening prices, the value that was formed at the start of trading; accordingly, it is formed as the average of the bid and ask prices and represents the first quote on the traded asset;
- The closing price of the trading period, the value of the asset, which was formed by the end of the trading period, is also formed as the average between the buy price and the sell price and represents the last quotation of the period.
- The maximum value of the trading period (high), which on the chart looks like the highest price peak, it is clear that this is the highest value of the asset in a particular trading period.
- The minimum price of the trading period (low) – the lowest value of the traded asset in a particular trading period.
The chart may also be preset tick volume, which is the number of ticks for a certain period of time. There are quite a few charts for real-time forex analysis, but the classical ones are line chart, bar chart, Japanese candlestick chart, tick chart.
A line chart (Fig. 3) is plotted at some value for a certain period. Most often it is based on the closing price, but this does not exclude the use of opening prices or extremes. The line chart is used by traders who can trade well on chart patterns that are very visible on the chart.
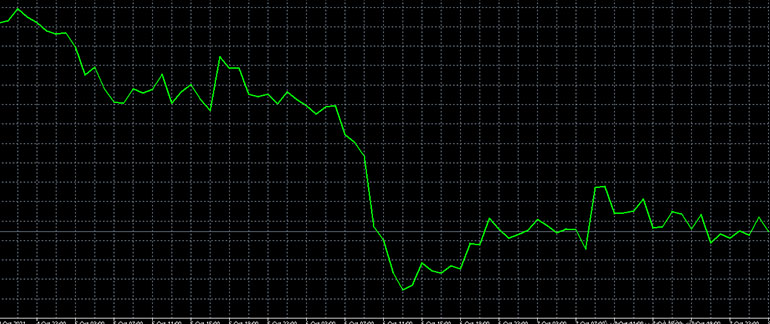
Image. 3
The line chart is the basic chart for the analysis, it is characterized by brevity, lack of redundancy of information, it shows the trend very clearly. However, it is not very popular, because it does not show what is happening within the trading period – whether there were significant rises or falls in value, which is important for determining the trend. It is also not possible to see value gaps (gaps) between trading periods on a line chart.
The bar chart, popular in tehanalysis, is constructed by four values already and represents vertical lines that indicate the fluctuations of the value within a trading period. The upper part of the vertical line is the maximum value at a particular time. The lower part of the vertical line, respectively, is the minimum price during the trading period. The line to the left of the vertical line is the level of value at the beginning of the period and it shows the opening value. The line to the right is the line which shows the value which was at the end of the trading period, that is, it shows the closing price.
The formal interpretation of the mutual position of the lines in tehanalysis is simple – if the left line is higher than the right line, it means that the value of the asset has increased, if the right line is higher than the left it means that the value has fallen. The chart of bars is informative, it allows you to determine what was happening during the trading period, to see if there were rises and falls in value, you can determine the gaps. However, without tehanalysis skills it is difficult to determine from the bar chart whether the market of the traded asset has risen or not. To determine the movements within the trading period it is necessary to zoom out the chart. With some skills, the bar chart allows you to implement any of the most complex strategies.
Japanese candlesticks – the oldest of the charts of technical analysis, most often it is used to demonstrate various Forex strategies. It is believed that the Japanese candlesticks are the most easily perceived visually. The chart is based on four basic prices. Each candlestick represents a period of trading time. The main part of the candle, the body, is a rectangle, and shows the range between the opening price and the closing price. The body of a candle can be black or colorless, but most often it is green or red. In this case, the green color means that the closing price is higher than the opening price, the asset is rising, the market is bullish. If red, the closing price is lower than the opening value, the price of the asset is falling, the market is bearish.
Candlestick lines below and above the body are also of great importance to the analysis. They are called shadows. Thus, the shadow above the candlestick’s body shows the maximum value, which was reached during the trading period. The shadow below the candlestick body, the lower shadow, shows the minimum that prices reached during the trading period. Other relatively popular chart types include Renko, there is also a cross/note chart, Kagi and others. Trading terminals forex brokers include several types of graphs to choose from.
Forex charts provide traders with complete information about the behavior of the asset for almost any time interval. Exactly thanks to the charts it is possible to train traders on historical data, to test and implement trading strategies. The ability to correctly analyze information on a Forex chart is a basic skill for a trader. For some strategies, you need to be able to read the chart not only correctly, but also quickly. By the way, some charts may have not an arithmetic but a logarithmic scale on which the divisions show the percentage change in price. It is most often used to analyze the long-term trend.
Graphic patterns
Over many years of trading on the forex market, it has become clear that the repetitive dynamics of the value is displayed in typical graphical patterns. Once you have seen these patterns, you can fairly accurately predict the further development of the trend. A whole system of technical analysis is based on graphical patterns.
Figure “Spike”
A spike (Figure 4) is formed when an asset rises or falls sharply, followed by a sharp pullback. If the value rises and then corrects to its original values, it is a bearish spike and means that the trend will continue to fall. If the value collapses and then quickly returns to its original value, it is a bullish spike, which indicates that the upward trend continues. A spike is relatively easy to identify on a line, bar, or candlestick chart. For example, on a candlestick chart, the pattern represents two candles, one of which is an impulse (trend dynamics), and the other is a return. Typical signs of a spike are that it is formed without a consolidation phase, there are no price fluctuations between the two faces of the spike, and the spike itself is pronounced.
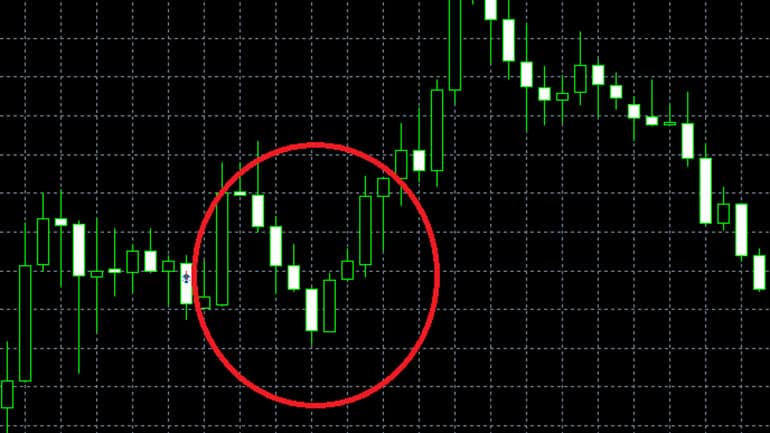
Image. 4
Despite the fact that the spike is a noticeable figure, trading on it is considered rather risky activity, because it belongs to the short-term patterns and one can simply not have time to place an order in time. It is not recommended to trade on this pattern if there is the slightest doubt that a spike is a spike and if there is a lack of time for the analysis of the situation. In addition, the spike is an elementary figure, it can be a part of another pattern, in relation to which the spike can either confirm forex signalor refute it.
Figure “Rhombus”
The “Rhombus” pattern, if it is pronounced, is considered a strong signal of an upcoming trend reversal in the Forex market. During the formation of the rhombus, trend fluctuations first create a diverging triangle on the chart, and then a symmetrical one emerges. When a trader suspects that a rhombus is forming, it is better not to trade. One should be ready to trade when the formation of a symmetrical triangle is completed. When the price breaks through one of the edges of a symmetrical triangle, the trader can open a buy or sell trade. For example, if a pattern forms on top of an uptrend, it is complete and a sell trade can be opened. The diamond is more clearly defined on a line chart, on a candlestick chart it is more difficult to see.
Figure “Rectangle”
The rectangle (Figure 5) is considered one of the simplest shapes in the market, although this does not mean that the pattern is easy to analyze on a chart. A pattern represents the range in which price moves after a clear trend is formed. The rectangle shows that the trend will continue to move in the same direction. Trading is done within this pattern, given that the volatility (price fluctuations) is about the same throughout the rectangle, that is, a flat, sideways movement is developing. The rectangle cannot last for a long time, and if the price breaks through one of its edges it indicates the change of the tendency and signals to open positions. But after the breakout the price can correct to the same position.
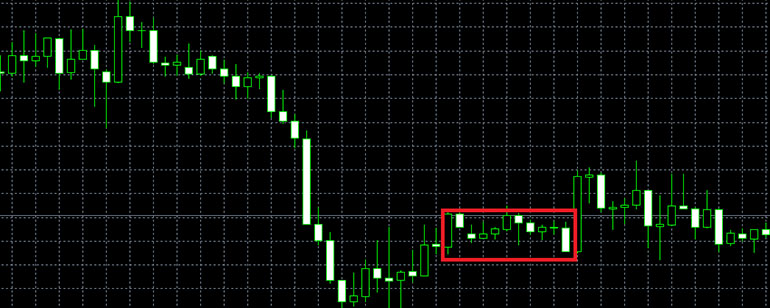
Image. 5
Head and Shoulders Figure
Head and Shoulders (and inverted Head and Shoulders) is a pattern all traders know, even if they do not trade by patterns, because it unambiguously indicates a trend reversal, although in reality Head and Shoulders in its pure form is not often seen on the chart. Head & Shoulders is formed on an uptrend, the reverse pattern appears on a downtrend. Graphically, the pattern is represented by three price peaks, with the middle peak higher than the right and left ones. And the inverted pattern is three lower peaks, of which the middle peak is the minimum price.
The Head & Shoulders pattern generates two signals – when it breaks the neck line and when it corrects to the neck line. On an uptrend in such a situation opens a sell trade. On an inverted pattern, a buy trade opens when the price breaks the resistance level (the neck line) from bottom to top after the second “shoulder” is folded and when the price corrects.
Figure “Triangle”
Triangles are popular in the Forex market, they are the most varied, represent fluctuations in the value, which as they move form the edges of the triangle lows and highs, until the price breaks through the formed triangle. A triangle pattern can be symmetrical, ascending or descending. A symmetrical triangle is formed by support and resistance lines drawn along three lows and three highs, respectively.
In most cases, a trade signal arises as a result of a breakout in the trend, but a symmetrical triangle is the least predictable. A descending triangle is formed by extrema that move in the direction of a downtrend and a breakout only confirms this trend. The ascending triangle, respectively, is broken in the direction of further price growth.
Double bottoms and tops
A double bottom is formed after a downtrend and is represented by the price touching a certain support line, but not breaking through it. This means that the downtrend is ending and an uptrend will soon begin. Positions are opened when the price breaks through resistance. A double top occurs after an uptrend when price touches two peaks of resistance and cannot overcome it. This means that the direction of trading reverses to a decrease in value. By now, traders have identified many typical patterns, from the simplest to the most difficult to identify because of the complexity, but only a few are basic and can be used both as the basis of a strategy and as an additional tool for indicator strategies.
Indicators
The modern trader’s answer to the question “How to do technical analysis of the forex market?” is “With the help of an indicator! Because technical analysis indicators are now the most popular price forecasting tool in computer trading terminals. Indicators are applied to the price chart, they are lines, histograms and other elements that, according to a certain algorithm based on historical dynamics, calculate the signal to enter or exit the trade.
Forex indicators are divided into trend indicators, oscillator indicators, volume indicators and others. Trend indicators and oscillators are used in forex trading. Trend indicators are lagging indicators and oscillators are leading indicators. Trend indicators are placed on the price chart and help to predict the trend direction and its reversal, respectively, they can generate signals to enter the trade or exit the trade.
Oscillator indicators are placed in a separate window below the chart and show relative values, not price values. Most often they are used as additional tools, confirming the signals of trend indicators. There are also indicators, which are loaded both as indicators proper and as oscillators. Most oscillators allow you to analyze the strength of the trend and overbought or oversold the asset, which allows you to determine in advance whether to enter or exit the trade.
Volume indicators in the Forex market are rarely used, they are found only at individual brokers. Indirectly, such indicators can help to determine the interest of traders in the asset, but very locally. There are a huge number of indicators developed, but the vast majority of traders use a limited set of indicators that have been tested by successful players.
The main indicator that is used in most forex strategies is the moving average. The Moving Average (MA) is the average arithmetic value of the price for a certain trading period. It is considered that МА is the most adequate indicator showing the asset movement. Many strategies use not one, but several moving averages, adjusted for different periods, which makes the trend forecast more detailed and accurate.
MACD Oscillator (Fig. 6), a histogram that is used to determine the convergence and divergence of two moving averages adjusted for different periods, in order to determine the direction and strength of the trend.
Stochastic Oscillator, a very popular indicator, which is formed from two lines, – the moving average and the line of the ratio of value to previous prices for a certain period of time. Its main task is to sift out false signals, paired with any indicator.
Bollinger Bands (Bollinger Bands) – trend indicator consisting of a moving average and support and resistance lines. The indicator helps to determine the direction of the trend and volatility of the traded asset, as well as generates fairly reliable signals at the time of crossing the Bollinger Bands.
RSI – The Relative Strength Index, an oscillator consisting of only one line, signals when an asset moves out of the overbought or oversold zone and is mostly used as a false signal filter in combination with some other indicator.
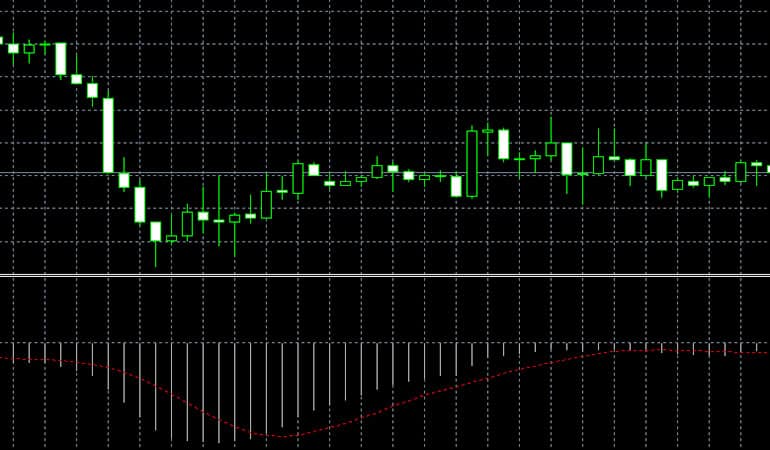
Image. 6
Trading strategies are formed on the basis of indicators, in which indicators interact with each other, confirming and clarifying signals. Indicators usually seem attractive to novice traders because they speed up and facilitate the trading process. But really effective indicators can be only when a trader understands exactly what they are for. Without understanding the essence of the trading process, forex indicators will only lead to quick and easy drain of the deposit.
This especially applies to the group of indicators, which assume only two signals – “buy” or “sell”. Work with indicators can be classified as the basics of trading, so it must be mastered diligently. It is important not only to know what, but also how to do technical analysis of Forex. There are also informative Forex indicators, such as an economic calendar for fundamental analysis or spread widget. Fundamental analysis means gathering and interpreting information from global markets and significant industry markets, stock indices, any economic and political events, significant to the forex market.
Advisors and trading robots
Forex trading is a rather monotonous, cyclic activity – this becomes clear when a trader has been trading for more or less a long time. The algorithmic nature of trading makes it possible to create programs that perform routine trading operations for the trader, based on the principles of tehanalysis. A huge number of forex advisorsThe most popular trading systems MT4 and MT5 can be found in the online stores, including free ones.
For a beginning trader, who has already encountered the complexity of the financial market, using a Forex trading advisor is a tempting idea, but quite risky because the advisor must be properly configured, and for this the trader must be able to trade profitably manually, independently. In order to make expert advisor bring profit, trader must be able to navigate the Forex market, read charts, use indicators, calculate profits.
If the robot is paid, then you need to be able to calculate the cost of its purchase, relative to the likely profit. You can choose an Expert Advisor based on the numerous ratings on the Internet – the choice of reliable robots with a good reputation on the market is not so great. Whether the Expert Advisor is paid or free, you need to be careful about the safety of the source from which it is downloaded and pay attention to the reviews of traders.
Testing strategies
When learning trading, a mandatory stage is practicing your skills in demo modes of trading terminals, before you start real trading. At the same time it is necessary to achieve full clarity of actions during the trading process. The simulation terminals should also be tested every time new trading tools are mastered and new strategies are implemented. By the way, you can also test your trading robot with a demo mode or a special tester program.