Arms Indicators
Contents
TRIN indicator
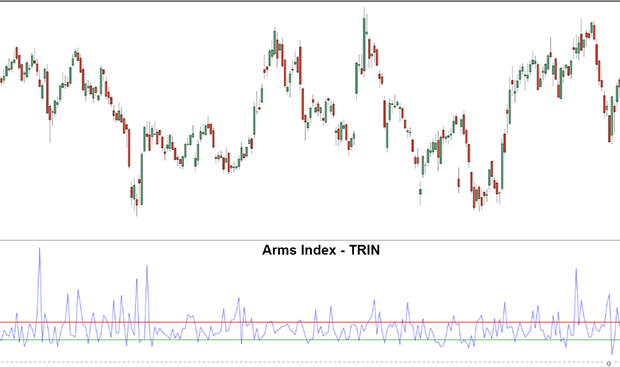
The Arms index was developed by Richard W. Arms Jr. back in 1967 under the name of Arms’ Short-Term Trading Index (TRIN, Figure 1). At present this index is of great importance, because it is a leading index at NYSE, i.e. it is a classical stock indicator (stock exchange). In some software products it is also called MKDS.

Image. 1
TRIN Indicator Description
In essence, TRIN is forex indicatorwhich shows the ratio of supply and demand in the market (The whole truth about forex).
The Arms Index is calculated using the formula: TRIN = (Growing Assets/Declining Assets)/(Volume of Growing Assets/Declining Assets).
And if after the solution the value is greater than 1, then the market is “bearish”, if less than 1 – the market is “bullish”. If the ratio equals 1, then there is an equilibrium between buyers and sellers. At the same time, if the index is equal to 1, then we should expect a change of trend. According to the author’s idea, the Arms index is a leading instrument for forex trading.
The peculiarity of TRIN indicator is that it has, so to say, an inverse relation to the market dynamics, that is the growth of TRIN indicators shows a bearish trend, and the reduction of the indicator shows a bullish trend.
The Arms Index is used for short-term trading because it allows you to quickly decide whether to buy or sell an asset. But it is considered to be more effective to use it as an overbought/oversold indicator. If the Arms Index is below 1, the market is overbought, if it is above 1, the market is oversold.
In this case the logic is standard – if the indicator falls to the overbought, it may be a signal to sell, if the indicator shows a high oversold, you can prepare to buy.
Traders note the versatility of using the Arms Index. It can be used with almost any asset, from global to very specialized ones. The Arms Index is an indicator for working on stock marketThe global market trends are often illustrated by this tool. But it is easy to find a way to use it for forex trading as well. Although it is not among the popular ones, not every trading terminal has it, even in the “Market” of Metatrader 5, it is difficult to find it in third-party sources of the network.
In addition, the use of the Arms index requires skill, and little has been developed specifically for working with it Forex strategies. And, in addition, the indicator is not so indispensable that you should purposefully look for it and use it in trading.
Log in to your broker’s terminal, add the TRIN indicator to the chart and see what comes out
| Broker | Bonuses | Open an account |
|---|---|---|
|
1
|
50 %
Bonus on deposit from $100 USD – promo code WELCOME50
|
Start |
|
2
|
From 25 To 60 %
Deposit increase for the first deposit
|
Start |
|
3
|
Cashback
Refunds of commissions, spreads and other costs
|
Start |
|
4
|
100 USD
Loyalty program remuneration
|
Start |
|
5
|
20 %
Bonus and cashback by promo code revieweek23
|
Start |
TRIN indicator signals
TRIN signals are informative, but it is recommended to use them after some practice, preferably with additional tools. Nevertheless, there are a number of Forex signalsThe index is not a good indicator, which can be considered as classic for this indicator. For example, you can consider opening a buy position when the index exits the oversold zone.
Accordingly, when the index exits overbought conditions, it is possible to open sell positions. In turn, the convergence in a falling market and the divergence in an ascending market are reversal signals. As for the index numerical values, Richard Arms argued that one can almost immediately buy assets when the index reading is 2.0, and when the reading is 0.2, one should sell.
Trading strategies based on TRIN
TRIN is most often used as a trend indicator with the addition of exponential moving average signals, it is considered optimal to set the period EMA 8 to 20.
For example, if the EMA is set up with an 11-day period, a buy is performed when the line exceeds 0.8. But if further the indicator decreases, it is recommended to close the position. If the EMA with the period of 21, the position to buy is opened when the indicator exceeds 2.1. But to implement strategies based on TRIN information, it is necessary after training on a demo account.
Since TRIN shows information “opposite” to the usual market (value above 1 – decline, value below 1 – rise), many traders use it in “inverted” form, that is opposite to the price chart. Then the lower marks of TRIN will correspond to the peaks of the price chart, and the upper marks of the index will correspond to the decline in prices.
One of the best additional indicators for the Arms index is also the NH-L stock indicator. Recall, NH-L is an index of new highs and lows on the trading chart. It shows the convergence or divergence of the indicator indicators with the price charts, the trend direction – its increasing indicators confirm a bullish trend, the decreasing ones – a downtrend. And also, if the NH-L indicator is above the zero line, the market is dominated by bears, if below – by bulls. As well as TRIN, NH-L indicator is used with moving averages to smooth out the indicators.
When interacting within a strategy, if the Arms index shows oversold, but the NH-L updates lower, it is a signal for continued bearish dominance. If TRIN shows oversold and NH-L shows bearish convergence, it could be a buy signal, and vice versa, if TRIN shows oversold and NH-L shows bullish divergence, it could be a sell signal.
EMV indicator
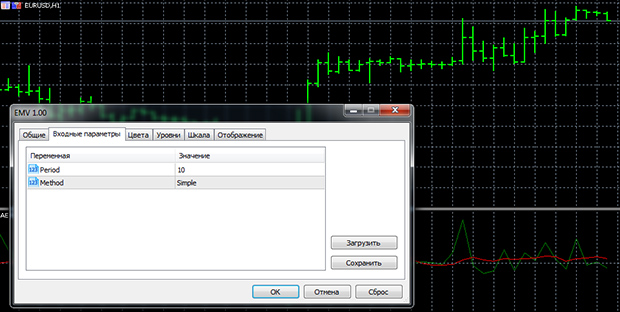
Richard Arms has created quite a few well-known indicators which can be successfully used in trading. The most famous indicator, which is sometimes used by forex traders, is the Ease of Movement Value (EMV, fig. 2) or the indicator of ease (freedom) of movement.
Image. 2
Description of the EMV indicator
It is also based on the indicators of market volume and its relation to prices, and its main task – to demonstrate how much trading volume is needed to shift the price. This indicator has a long history of successful application in stock market trading, is now also quite popular in the binary options trading.
But since not so long time the indicator is also used in forex trading, it appeared in the “Market” trading platforms. There are not a lot of strategies for it yet, also because it does not have any distinct advantages over other indicators and oscillators for forex.
On the price chart, the EMV is represented as a histogram, a line or both a line and a histogram. Just like the Arms index, this indicator has a fairly uncomplicated interpretation of signals.
Thus, if the indicator rises, it means that prices are rising, while trading volumes are small, it allows you to expect a reversal. If the EMV value is decreasing, it means that prices are decreasing at low market volumes – a reversal can be expected. Correspondingly, if the EMV values are near zero, it shows uncertainty in the market.
The Ease of Move indicator is calculated using the following formula: EMV = Midpoint Move/(Volume/High-Low), where: Midpoint Move = (today’s high + today’s low)/2 – (yesterday’s high + yesterday’s low)/2.
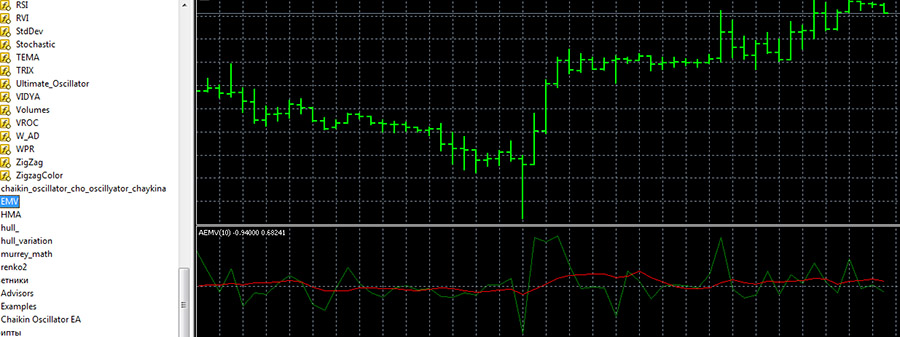
EMV is not included in the list of standard indicators of trading platforms, in particular in MetaTrader 4 and 5. You can find it, for example, here: https://www.mql5.com/ru/code/20698.

Image. 3
Going to the “path”: “Insert” – “Indicators” – “Custom”, you need to find the indicator file on your computer, load it into the program folder, then add it to the price chart. You can also find it in the “Navigator” on the left side of the terminal. In the settings you can change the type of moving average for smoothing indicators, type of indicator, data for calculation.
EMV indicator signals
The EMV indicator readings are generally uncomplicated: an increase in the indicator values shows that asset prices are rising with low trading volumes. This can mean that even a small volume can change the trend on the market. Correspondingly, a decrease in the EMV values shows that the prices of the asset are falling at low trading volumes and a change in the trend at low trading volumes is possible.
Fluctuations of EMV in the zero zone, on the contrary, show that a large trading volume is required for a trend change. If the indicator shows large positive values, it indicates that the price is increasing, but trading volumes are low, conversely, large negative values indicate that the price of the asset is decreasing with low trading volumes.
A signal to buy is when the moving average crosses the indicator’s zero line from bottom to top and develops further. On the contrary, a signal to sell can be considered a crossing of the zero line of the indicator by the moving average from above downwards.
In some versions of the indicator for MT4 and MT5 its color is informative. For example, the uptrend colors the indicator histogram in blue, the indicators here are above zero mark. The downtrend colors the histogram in red, the marks are below zero.
Points to enter or exit the market using the EMV are marked during a trend reversal. For example, if the zero level is crossed from the bottom up and the histogram changes color from red to blue, you can consider the probability of opening a buy position. Correspondingly, if the histogram crosses the zero level from top to bottom and changes its color from blue to red, it is assumed that a sell position can be opened. The divergence manifests itself in the fact that the price, when renewing its peak, is shown by the indicator histogram as lower than the previous one, and when renewing the new minimum it shows that it is not lower than the previous minimum.
Trading strategies based on EMV
The easiest way to use the EMV is to trade only on its indicators. If the indicator is in the positive zone – perhaps you should open a buy position and close it when it moves into the negative zone. If the indicator is in the negative zone, you can open a sell position and close it when it moves into the positive zone.
But it is not recommended to use the indicator without additional instruments. More precisely, if EMV is used, it is most often used as an additional oscillator within strategies with other indicators and serves to confirm market entry or exit signals from other indicators.
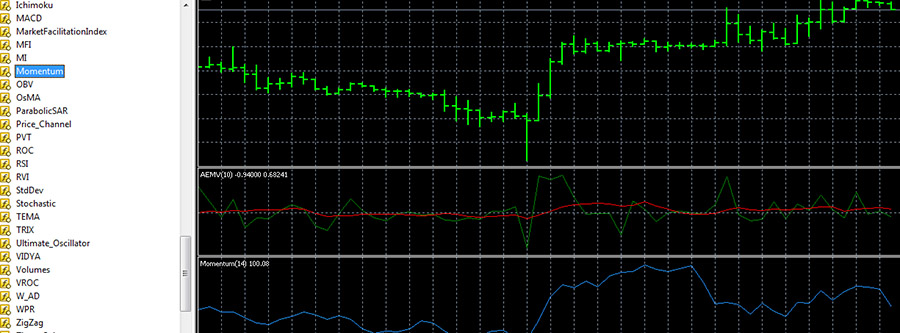
Image. 4
It can be an indicator RSI, Momentum (Fig. 4) or any type of resistance and support lines. In any case, before applying EMV in practice, you should practice on a demo account.
Conclusions
Arms indicators, although not so popular among traders in different markets, but they can help them in analyzing the dynamics of assets, show the current trends, the exact signals for entering the market, etc.

