Relative Vigor Index (RVI) Oscillator
Contents
Description of Relative Vigor Index Oscillator
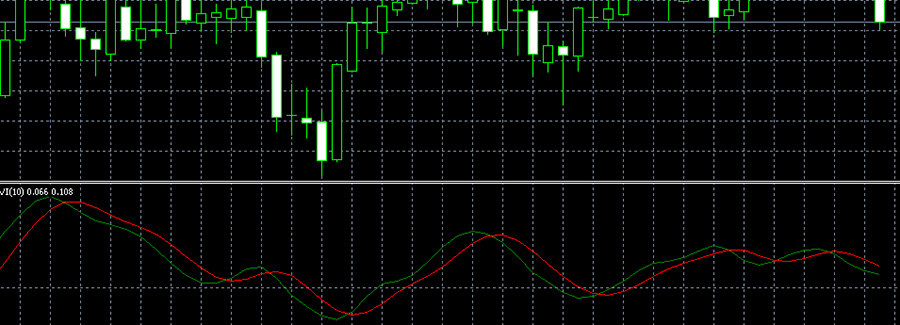
The Relative Vigor Index (RVI) oscillator was created by John Ehlers, one of the leading experts in technical analysis, a proponent of cyclical market theory and creator of many others. indicators for forex (Fig. 1). The RVI has been in use relatively recently, since 2002, and has not yet reached its full potential.
Image. 1
The RVI is based on a simple rule: on an uptrend, prices close above the opening price; on a downtrend, they close below the opening price. The price shows the balance between buyers and sellers at a certain moment. The RVI oscillator reflects the “vigor”, the power of the current trend energy, the confidence of the movement from the closing prices in the range of minimum and maximum prices of a certain period. Focusing on these indicators a trader can rather confidently predict continuation or completion of a trend (forex analytics).
The Relative Vigor Index is calculated using the formula:
RVI = (Close – Open)/(High – Low), where: Open – opening price; High – maximum price; Low – minimum price; Close – closing price.
By the way, the abbreviation RVI also means a completely different indicator – Relative Volatility Index, often beginners confuse these indicators (Forex Trading Training). Volatility Index does not give signals and is not included in the standard set of trading terminals, but it can be used with the same Relative Vigor Index.
In addition, novice traders can try to use the RVI as a Stochastic or another similar forex oscillator. You can’t do that – they are really similar, but built on different principles. By the way, that’s why Stochastic and RVI, when used together, can give more accurate signals for forex trading.
The RVI in the trading terminals is placed at the bottom of the price chart and consists of two lines. As a signal line is placed a moving average with a certain period, depending on the strategy, usually it is a red line. The main line, RVI, often blue or green, actually shows the “vivacity” – energy and confidence of the market movement. The signal line serves to smooth out the values of the main line.
Log in to your broker’s terminal, add the RVI oscillator to the chart and see what comes out
| Broker | Bonuses | Open an account |
|---|---|---|
|
1
|
50 %
Bonus on deposit from $100 USD – promo code WELCOME50
|
Start |
|
2
|
From 25 To 60 %
Deposit increase for the first deposit
|
Start |
|
3
|
Cashback
Refunds of commissions, spreads and other costs
|
Start |
|
4
|
100 USD
Loyalty program remuneration
|
Start |
|
5
|
20 %
Bonus and cashback by promo code revieweek23
|
Start |
RVI Oscillator in the MetaTrader 5 Platform
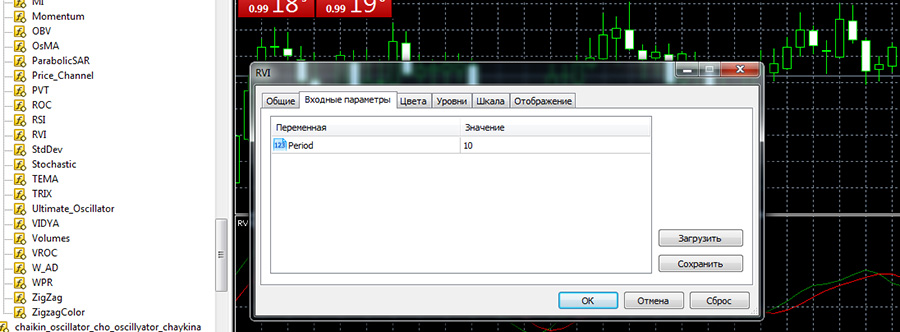
Relative Vigor Index is among the standard oscillators of MT4 and 5 terminals. In MT5 it is placed in the navigation panel on the left (Fig. 2):
Image. 2
By default, the Relative Vigor Index indicator period is 10 (Fig. 2), but it can be changed according to forex strategy trader. The higher the period, the smoother the readings will be. If the indicator is used regularly and serves as the main one for forex strategies, the necessary period is determined by experience.
Standard indicator colors in MT5 are red for the signal line and green for the RVI line. For some strategies, one of the lines can be colored to make it invisible in the trading terminal. The zero level is marked in MT5 with a dotted line. You can also set an additional indicator level if necessary. Some traders set two additional levels below and above the zero level for more precise orientation in the situation.
RVI oscillator signals
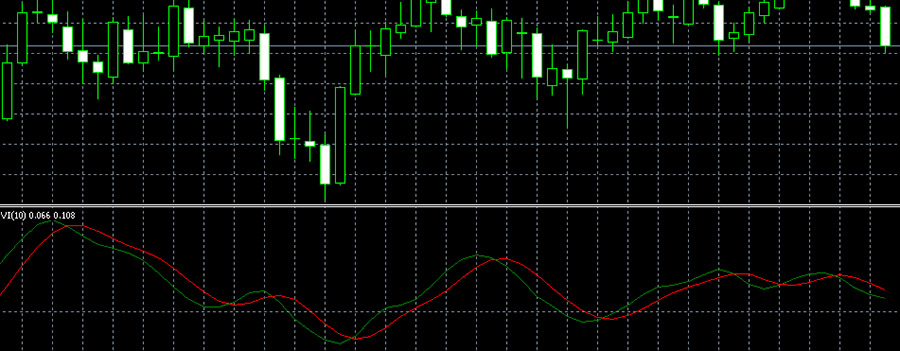
Typical Forex signals oscillator of relative vigor – crossings. If the fast (red) RVI line crosses (Fig. 3) the signal slow line (green) from top to bottom, it is a signal to buy, if from bottom to top – to sell. Positions are held until the oscillator line and the signal line are crossed inversely in value, which is a signal to open a sell trade:
Image. 3
Simple signals are the position of the lines relative to each other. If the fast line of the indicator is placed above the slow line (Fig. 4), it shows the dominance of buyers, if the fast line is below the slow line, it shows the dominance of sellers.
The property of the relative vigor indicator to take positive and negative values is used to determine the mood of the forex market (The whole truth about forex). If both indicator lines are above zero, the RVI line is placed above the signal line, the market is dominated by buyers. If both indicator lines are below zero level, the RVI line is placed under the signal line, then sellers prevail on the market.
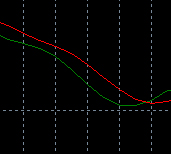
Image. 4
Divergences are considered a very strong indicator signal. If the price updates the maximum or minimum, but the indicator indicators do not confirm it, the trend is preparing for a reversal. The trader should be ready to cross the RVI lines and the signal line to open a position.
The direction of the trend can be determined by the indicators of the indicator in question, if it is set with a long period, from 100 or more. In this case, if RVI lines are above zero level (Fig. 5), only buying signals are taken into account, and if below zero, only selling signals are taken into account.
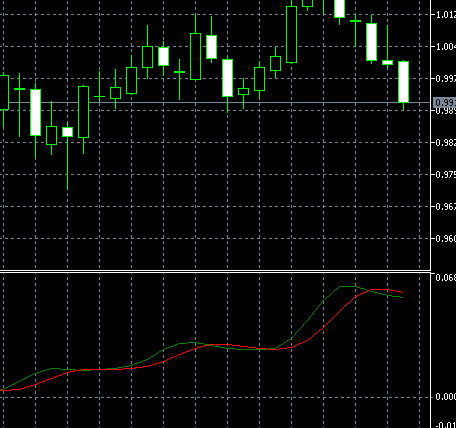
Image. 5
It is believed that a period of 100 or more is optimal for long-term trading, and a period of 10 or less – for short-term trading.
Trading strategies based on RVI
The Relative Vigor Index Oscillator is not recommended for use without indicators. But when implementing strategies with other indicators RVI increases their effectiveness and accuracy.
RVI with standard settings is applied with exponential EMA with a period of 21 (Fig. 6). In this strategy, a buy signal will be the price crossing the moving average from bottom to top, the EMA must lock on the price, and the RVI lines will point up. The signal to sell will be the price breaking the EMA from above downwards and the RVI lines pointing downwards:
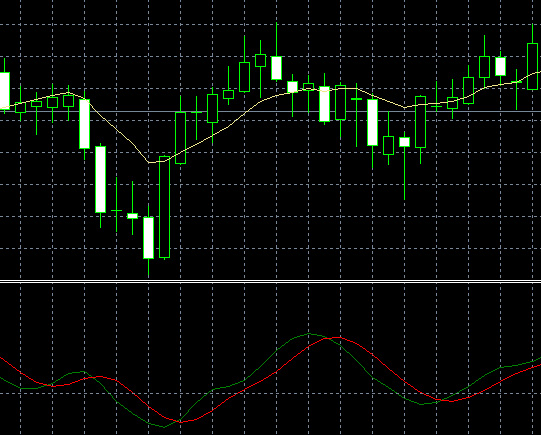
Image. 6
To implement a strategy with only one RVI, first the levels are determined, which show the overbought or oversold condition of the asset. When the indicator line crosses the designated level, the trader opens a trade. In this case the RVI works as an oscillator and partly as a trend indicator.
The trader marks levels by the lowest and highest points of the indicator fluctuations, if the RVI line crossed the lower boundary of the range, and then returned back, it may be a signal to buy. On the contrary, if the line has crossed the upper boundary of the “corridor” and returned back, it may be a signal to sell. But effective long-term application of this strategy without additional indicators is hardly possible and not recommended.
The strategy is used on the formed trend, since at the beginning of trend creation the indicator can generate a lot of false signals. RVI can effectively complement trading, which is based on graphical patterns on candlestick chart. The pep indicator in this case serves as a confirmation signal that generates the pattern.
Another strategy involves the use of the RVI indicator with a period of 100 of two EMAs (Fig. 7), one with a period of 18 and the second with a period of 28. The strategy is implemented on a timeframe of 1 hour or more.
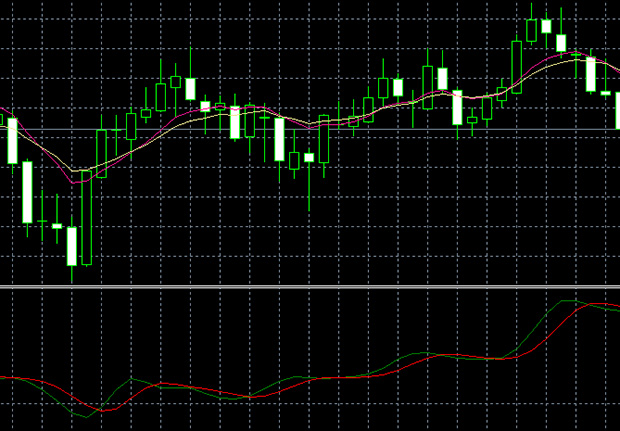
Image. 8
This strategy is to wait for the green RVI line to cross the red line from the bottom up, while the price should be placed above both moving average lines, this will be a buy signal. A signal to sell would be when the green RVI line crosses the red line, and the price is placed below both moving average lines.
To confirm the signals of this strategy, it is advisable to mark the direction of the trend not only with the relative vigor indicator, but also on the older timeframe. The movement of the RVI lines, synchronous with the moving averages, also confirms the signal. Positions are held until the signal is reversed.
One of the well-known strategies with RVI – in combination with indicators Alligator and simple moving average. The strategy is implemented on the timeframe of M5 and larger. In it the RVI signal line does not matter much, so it can be marked with color, which makes it inconspicuous. RVI is set with a period of 10.
Alligator is set with the standard settings – periods 13, 8, 5, shift 8, 5, 3, MA method – Smoothed, apply to Median Price (HL/2). Moving Average MA is set with a period of 10. When trading on short timeframes, it is additionally recommended to check the signals on higher timeframes.
The Alligator indicator determines the main trend on the high timeframe. If the Alligator “opens the mouth”, the lines are located in the order 5 > 8 > 13, it means the trend is upward. Positions are opened on the lower timeframe to buy if the RVI line has crossed the MA upwards. Positions to sell are opened if the Alligator on the higher timeframe “opens the jaws” in the order 13 > 8 > 5, the RVI line crosses the moving average downwards.
In the other strategy, the RVI is applied only with two Simple Moving Average, on a timeframe of half an hour to an hour. One SMA is set with a period of 9, the other with a period of 100, the RVI with a period of 100.
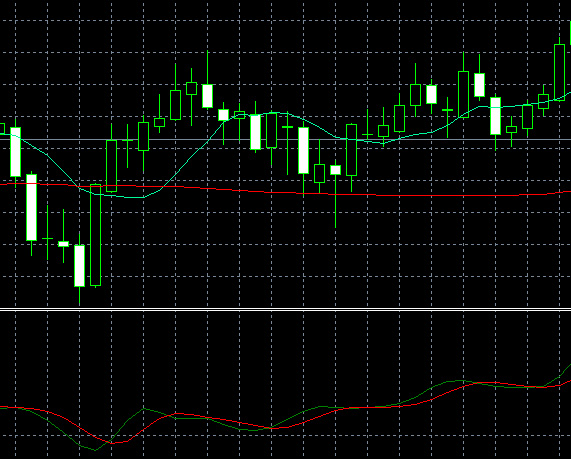
_
Signal to buy – RVI above 0, moving average with period 9 crosses MA with period 100 upwards. If the 9 SMA crosses the 100 SMA from above downwards and the pep indicator is located in the area below zero, this is a sell signal.
Conclusions
The Relative Vigor Indicator can hardly be used for trading without other instruments. It is optimal to use it to confirm the signals of trend indicators. The disadvantages of the RVI can also include false sell signals in an uptrend and the same buy signals in a downtrend. Efficient trading using the indicator is possible only on the trend.
Many traders even believe that it is best to use the RVI on a flat, not applying it on a pronounced trend. The indicator calculates price based on past price trends, so it can be overwritten. In addition, unlike many other oscillators, the RVI does not show overbought and oversold zones.
Because of such disadvantages among traders, it is possible to meet the statement about the impossibility of constant use of this oscillator. But although the RVI is not a very popular indicator, mainly due to the large number of false signals, it has many supporters who use it with good results. The RVI, when properly applied, generates quality signals and can even be used as a filter due to smoothing. It is believed that the Relative Vigor Index is best used on timeframes from M15, but not too long.
