Modern technical indicators for successful binary options trading in 2024
Contents
Leading brokers strive to provide their clients with the most advanced tools for successful trading. One of the key areas of development is the implementation of new technical indicators capable of providing traders with all the necessary information to make informed decisions. Let’s consider several indicators that are most commonly used by trading platforms of leading brokers in 2024.
Ichimoku Indicator (Ichimoku Kinko Hyo)
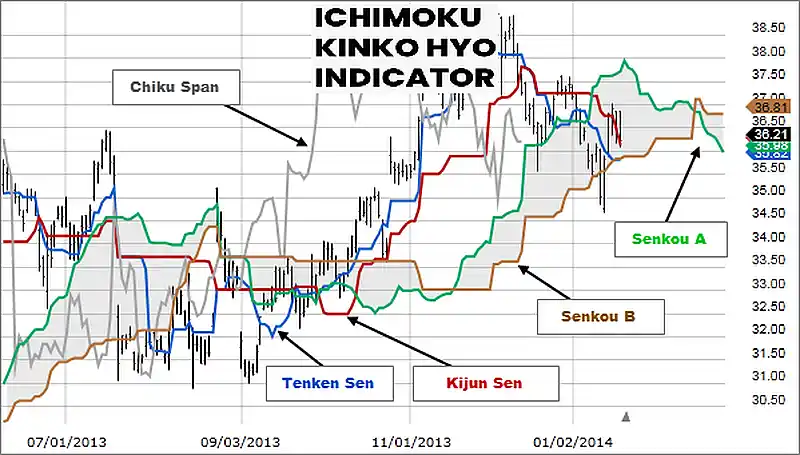
Ichimoku is a complex indicator of Japanese origin that is becoming increasingly popular among traders in various markets due to its versatility and effectiveness. In 2024, trading platform developers may implement this powerful tool for traders. The indicator consists of several components, each of which performs its function:
- Tenkan-sen (conversion line) to determine short-term trends and potential reversal points.
- Kijun-sen (standard line). Helps identify medium-term trends and support and resistance levels.
- Senkou Span A and Senkou Span B (cloud lines). Form a cloud that visualizes support and resistance zones. The thickness of the cloud indicates the strength of these zones.
- Chinkou Span (lagging line). Tracks price momentum and helps confirm current trends.
Advantages of use:
- Versatility: Ichimoku can be used to analyze any assets, including currency pairs, stocks, and commodities.
- Multifunctionality: The indicator allows simultaneous evaluation of trend, support and resistance levels, and momentum.
- Effectiveness on different timeframes: Suitable for both short-term and long-term trading.
The Ichimoku indicator generates signals based on line crossings and cloud direction. For example, when Tenkan-sen crosses Kijun-sen from bottom to top, it is considered a bullish signal to buy, and when it crosses from top to bottom, it is a bearish signal to sell. Clouds help identify zones where price may encounter support or resistance and provide an insight into the current market state – trending or ranging.

Chaikin Money Flow Indicator (Chaikin Money Flow)
The indicator, developed by Marc Chaikin, is a powerful oscillator that measures the money flow into a particular asset. This indicator allows determining the real strength or weakness of a trend, which is important for making informed trading decisions.
The Chaikin indicator is calculated based on trading volume and price changes over a specific period. The main idea is that if the closing price of an asset is closer to its period’s high, the money flow is considered positive. If the closing price is closer to the low, the money flow is considered negative. Advantages of using the Chaikin indicator:
- Detection of divergences: The indicator helps detect divergences between price and money flows, which may signal a trend reversal and provide traders with early signals to enter or exit positions.
- Trend strength analysis: The shape of the Chaikin histogram can determine the strength of the current movement. For example, prolonged values above 0 with increasing amplitude indicate a strong bullish trend.
- Ease of interpretation: The indicator is relatively easy to use, making it suitable for both beginners and experienced traders.
Examples of usage:
- Bullish signal. If the price of an asset is rising and the Chaikin indicator is also in the positive zone, it confirms the strength of the trend and may serve as a signal to buy.
- Bearish signal. If the price of an asset is falling and the indicator is in the negative zone, it confirms the weakness of the trend and may serve as a signal to sell.
- Divergences. If the price reaches new highs and the Chaikin indicator does not confirm this movement and shows negative values, it may indicate a possible reversal and serve as a signal to open a short position.
Volume Flow Indicator (VFI)
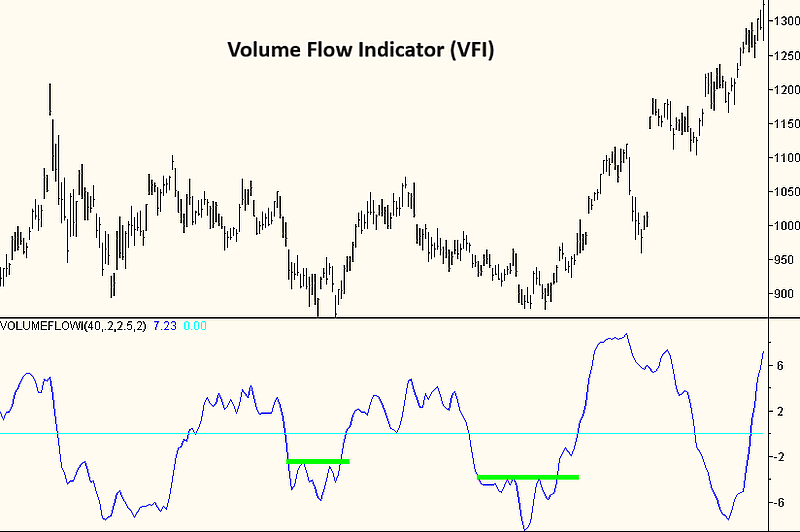
VFI is an advanced technical tool that combines two key market indicators: price and trading volume. The indicator provides traders with a unique opportunity to assess the strength of current market movements by analyzing the ratio of volume traded on upswings to volume traded on downswings. The Volume Flow Indicator measures the ratio of buying to selling volume, providing valuable information about the direction and strength of the trend. The indicator takes into account not only the closing price but also volume dynamics, making it more accurate and sensitive to changes in market sentiment.
Advantages of using the VFI indicator:
- Trend confirmation. VFI helps confirm current market trends by analyzing whether trading volume is predominantly on the upside or downside. Values above 50% indicate a bullish market, where buying volume exceeds selling volume, confirming the strength of the uptrend. Conversely, values below 50% indicate a bearish market dominated by selling.
- Signal generation. Indicator signals are generated when the level of 50% is crossed. When VFI rises above 50%, it signals the beginning of a bullish trend, providing traders with an opportunity to open long positions. When VFI falls below 50%, it indicates a bearish trend, signaling the opening of short positions.
- Divergence detection. VFI is useful for identifying divergences between asset price and trading volume. If the asset price continues to rise while VFI begins to decline, this may signal an impending trend reversal.
- Integration. VFI can be combined with other indicators such as moving averages or oscillators to increase signal accuracy and develop comprehensive trading strategies. For example, using VFI in combination with the Relative Strength Index (RSI) can help traders confirm overbought or oversold signals.
Examples of usage:
- Bullish signal. When VFI rises above 50% and is confirmed by an increase in the asset price, it signals the start of a strong bullish trend, providing traders with an opportunity to open long positions.
- Bearish signal. When VFI falls below 50% and is confirmed by a decrease in the asset price, it indicates a bearish trend. This is a signal to open short positions.
- Divergences. If the asset price reaches new highs and VFI does not confirm this movement and remains below 50%, it may indicate a possible reversal and serve as a signal to exit long positions or open short ones.

Stochastic RSI Indicator
Stochastic RSI is a combination of two popular indicators – Stochastic and RSI, providing more accurate signals of overbought or oversold conditions of an asset. It is an RSI oscillator indicator applied to the RSI value, making it more sensitive to price changes. Stochastic RSI measures the position of the current RSI level relative to its range over a certain period of time. Indicator values range from 0 to 1, where values above 0.8 indicate overbought conditions, and values below 0.2 indicate oversold conditions.
Advantages of using the Stochastic RSI indicator:
- Increased accuracy. Combining two indicators allows for more precise signals. Using a stochastic oscillator based on RSI values helps identify moments when an asset reaches extreme levels, indicating potential reversal points.
- Quick response to changes. The indicator reacts quickly to market changes, allowing for timely decision-making. This is especially important for trading binary options, where the accuracy and timeliness of entering a trade are crucial.
- Signal confirmation. Stochastic RSI can be used to confirm signals from other indicators. For example, when used alongside MACD or simple moving averages, it can confirm trend signals and help avoid false entries.
- Identification of overbought/oversold conditions. This is useful for finding entry and exit points. It is suitable for flat markets where the price moves within a limited range.
Examples of usage:
- Bullish signal. When Stochastic RSI rises above 0.2 from the oversold zone, it may serve as a signal to buy.
- Bearish signal. When it falls below 0.8 from the overbought zone, it may serve as a signal to sell.
- Divergence. If the price reaches a new high or low and Stochastic RSI does not confirm this movement, it may indicate a possible trend reversal.
These indicators, used by leading brokers, provide binary options traders with powerful tools for market analysis and making informed trading decisions. By combining them with other methods of technical analysis, traders can significantly increase their efficiency and profitability.
Reviews