Accelerator Oscillator (AC)
Contents
Description of the Accelerator Oscillator
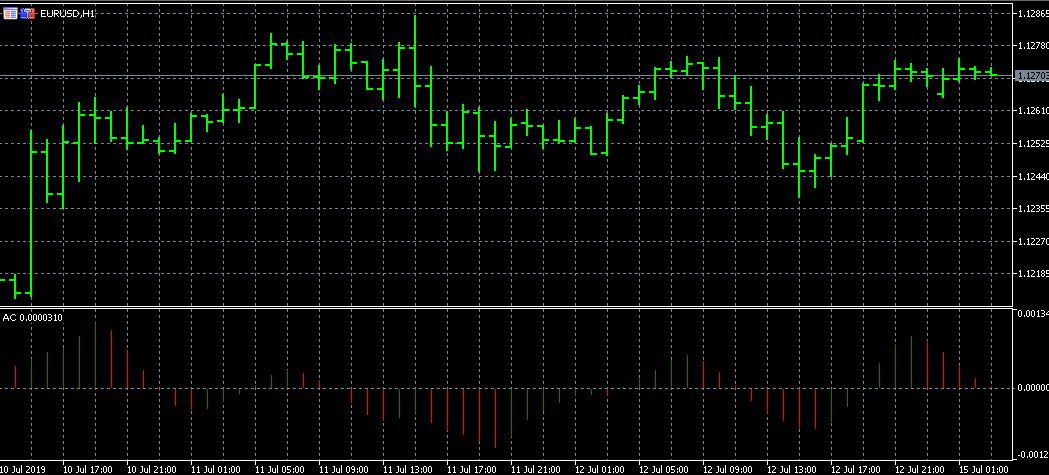
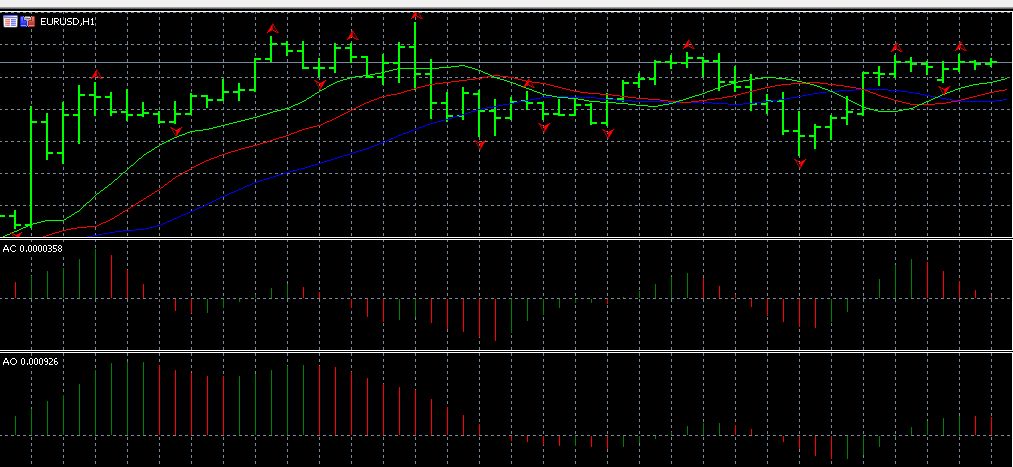
The Acceleration/Deceleration (Accelerator/Decelerator Oscillator, AC, Image 1) is one of the technical analysis tools created by Bill Williams.
Image 1
The essence of the oscillator is to see the approaching change in the price of an asset, by the change in the driving force of the market, and even earlier. Bill Williams proceeded from the fact that before the market driving force changes, its acceleration falls to zero, then develops in the other direction. It is the moment when the acceleration slows down that the Accelerator captures. That is, the Acceleration/Deceleration oscillator is conceived as a strongly leading oscillator.
Log into your broker’s terminal, add the Accelerator Oscillator indicator to the chart and see what comes out
| Broker | Bonuses | Open an account |
|---|---|---|
|
1
|
50 %
Bonus on deposit from $100 USD – promo code WELCOME50
|
Start |
|
2
|
From 25 To 60 %
Deposit increase for the first deposit
|
Start |
|
3
|
Cashback
Refunds of commissions, spreads and other costs
|
Start |
|
4
|
100 USD
Loyalty program remuneration
|
Start |
|
5
|
20 %
Bonus and cashback by promo code revieweek23
|
Start |
Accelerator Oscillator signals
A lot of people have oscillators for forex a zero line crossing is itself a signal, but one of the characteristic features of the Acceleration/Deceleration oscillator is that a zero line crossing is not a signal (Forex Signals). However, the zero line AC (Image 2) is a line of some kind of balance of momentum and acceleration, so if the oscillator indicators above the zero level, the market is dominated by buyers, and if below, the sellers prevail.
Image 2
By its interpretation, AC is one of the simplest indicators, practically, you can track only the change in color of the histogram bars and make the right decisions. In particular, it is not recommended to buy if the current bar of the histogram is red, or not recommended to sell if the current bar is green.
When trading in the direction of the driving force, if the Acceleration/Deceleration oscillator is placed above zero for buying or below zero for selling, the signal to buy will be two green bars in the ascending sequence, and two red bars in the descending sequence for selling (Image 3).
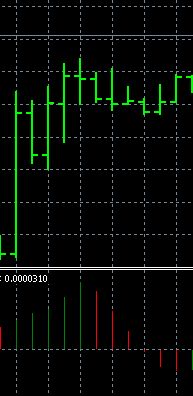
Image 3
When trading against the driving force, that is, if the indicator is placed below zero when buying and above zero when selling, the signal to buy will be three green bars in an ascending sequence, below the zero level or, to sell, three red bars in a descending sequence, above zero level.
The formula is
The formula of the Acceleration/Deceleration oscillator is based on the indicators of another Williams’ indicator – Awesome Oscillator and is calculated as the difference between the Awesome Oscillator and the 5-period moving average of the Awesome Oscillator.
AC = AO – SMA (AO, 5).
At the same time
AO = SMA (MEDIAN PRICE, 5) – SMA (MEDIAN PRICE, 34),
MEDIAN PRICE = (HIGH + LOW) / 2
Where:
MEDIAN PRICE is the median price;
HIGH – the maximum bar price;
LOW – the minimum bar price;
SMA – simple moving average;
AO – Awesome Oscillator indicator.
It should be noted that Bill Williams himself suggested to use periods 5 and 34, but practical application has revealed a large number of false signals with these parameters, so each trader determines his own parameters as he gets used to the oscillator.
AC in the terminal
Accelerator Oscillator (AC) oscillator is quite popular, so it is pre-installed on trading platforms. On MT5 it is in the list of Bill Williams indicators in the navigation panel on the left (Image 4).
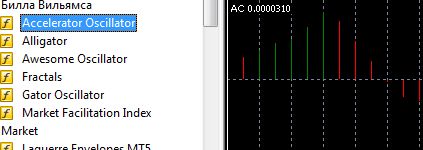
Image 4
The oscillator is a histogram of red and green columns, the zero line and positive and negative values. The interpretation of the colors is classical – green shows the upward price direction, red – the downward price direction.
All about forex
Strategies with the AC
Accelerator Oscillator should be used mainly as a supplementary indicator to other instruments of technical analysis (forex strategies). Also, when applying AC, you must remember that it redraws the last column, so you should not open a position without making sure that the sequence is complete.
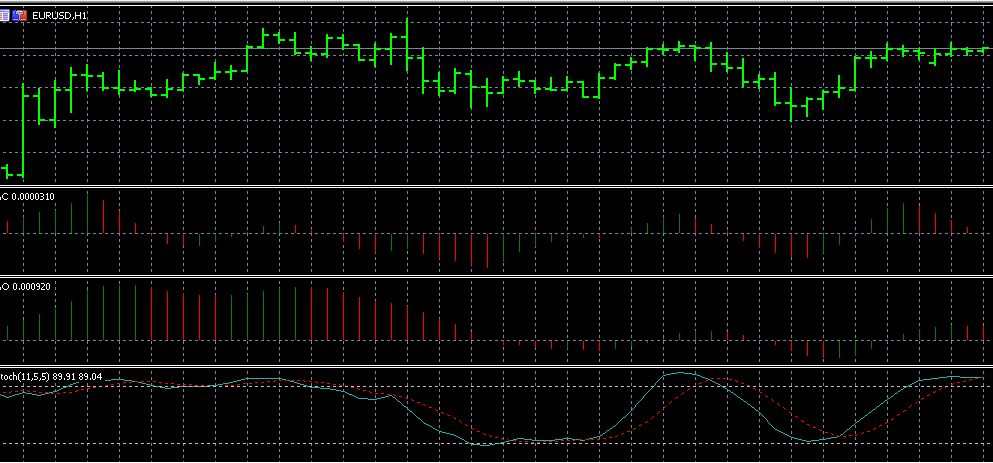
Accelerator Oscillator is an integral part of strategies using other Bill Williams indicators, but it is also used with other indicators often and quite effectively. One of the popular ways to use Accelerator Oscillator together with Awesome Oscillator and Stochastic (Image 5). The strategy is implemented on the timeframe of H1 and larger. AO and AC are set with preset parameters, Stochastic is set with parameters 8, 3, 3, prices by “Close/Close”, MA simple.
Image 5
Buy positions are opened when stochastic %K line crosses the level of 20 from below upwards, and both Williams indicators will be colored green. Sell positions are opened when the %K line crosses the 80 level downwards, and the Awesome and Accelerator indicators are colored red. Accelerator Oscillator can also be used with Stochastic only. The strategy is implemented on timeframes of H4 and larger. Stochastic is set with parameters 5,3,3 and levels 20 and 80, the AC oscillator with standard settings.
A buy signal is formed when the stochastics line crosses the signal line upwards and the AC columns are colored green. Correspondingly, a sell signal is formed when the blue line crosses the red line from top to bottom and the AC columns are colored red.
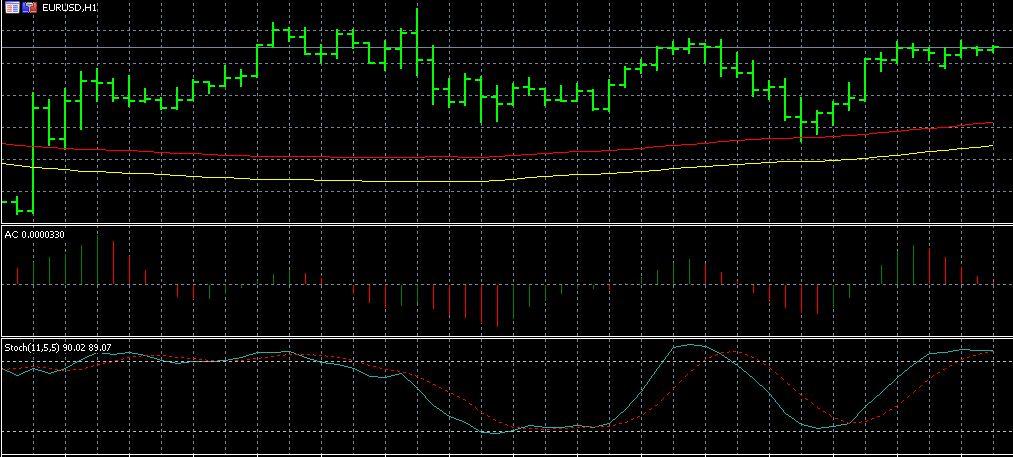
In another strategy to the Accelerator Oscillator and Stochastics are added two moving averages with a period of 10, one of which is built on the minimum prices, and the second on the maximum (Image 6). Stochastic is set with parameters Accelerator Oscillator, AC oscillator standard. The strategy is implemented on the timeframe H1 and larger.
The signal to buy will be the placement of the signal line of stochastics below the main line and their placement below the level of 50. The price should break the MA built on the highs. Next, you need to monitor the dynamics of the trade and completely close the position when the Accelerator Oscillator indicator forms two red bars.
Image 6
The signal to sell will be the placement of the signal line of the stochastics above the main line, and both of them should be placed above the 50 level. The price should break through the MA built on the minima. Then the dynamics of the trade is monitored and it is completely closed when the Accelerator Oscillator forms two green bars. Another strategy implies using the Accelerator Oscillator and the Awesome Oscillator along with the HMA. Williams’ indicators are set with standard settings, HMA with period 34. In this strategy it is preferable to use the colored HMA, as the color change of this line shows the growth better.
Positions to buy are opened when Awesome and Accelerator Oscillator are colored green and placed above zero level, and the HMA indicator shows an increase in direction and the corresponding color. Sell positions are opened when both Williams’ indicators are colored red and are situated below zero level, and the HMA indicator line shows decline.
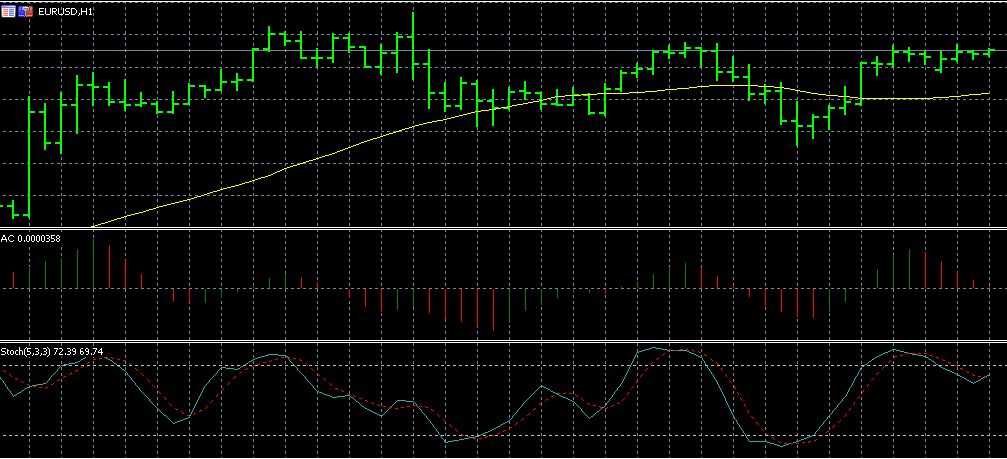
The other strategy uses Accelerator Oscillator, Stochastic (5,3,3) and a simple moving average with a period of 33 (Image 7).
Image 7
Buy is carried out when the AC is placed above the zero line and colored green, while the stochastic is placed above the central level of the Accelerator Oscillator and the price is above the SMA. Selling is carried out when the AC is placed below zero, the Stochastic is placed under the central AC line, and the price is under the sliding AC line.
A popular method of applying the Accelerator Oscillator indicator is the strategy with Parabolic SAR, which also uses Awesome Oscillator. Williams indicators are set with standard settings, as well as the Parabolic SAR indicator.
Buy positions are opened when Parabolic SAR is placed below the price, and Awesome and Accelerator oscillators will be colored green. Sell positions are opened, when Parabolic SAR is placed above the price, and Awesome and Accelerator oscillators will be colored red.
Bill Williams has developed a strategy for his indicators (Fig. 8), which is used by many traders. It uses the Alligator, which determines the beginning of the price movement and its direction, Accelerator Oscillator is needed to determine the acceleration or deceleration of price, Awesome Oscillator marks the price reversal, and such indicators as Fractals are used to determine entry points. The strategy is implemented on timeframes of H1 and larger.
Image 8
Entry into trading on this strategy is made when the market is still in a calm state, the subsequent actions are carried out with an open position. Therefore, when starting work, all Alligator lines should be placed on the same plane in a stable condition, Accelerator Oscillator and Awesome Oscillator should oscillate near the zero level. In this situation, the trader determines the entry points according to the fractals, and opens the positions according to the breakdown of the last fractal. Williams further recommends opening positions in the direction of the trend, based on the fractal breakdown signals.
Accelerator Oscillator can be used in a strategy with only one Alligator, in which case the signals are marked by the Alligator indicator. It can be a crossover of the moving lines, which should confirm the Accelerator Oscillator. It is not recommended to use Accelerator Oscillator as the only trading tool, although such strategies do exist. One such strategy involves trading on the timeframe of H4 and larger, and its essence is to open a position on certain bars.
For example, when the 61st bar closes, a buy position is opened on the 62nd bar, provided that the AO is placed below the zero level. The sell position is opened on the 62nd bar, if the oscillator is placed above the zero level.
According to another version, positions are opened by the Accelerator Oscillator indicators of the previous 80 bars, to buy – after the 80th bar closes and the 81st bar opens, provided that the AO is placed below the zero level, to sell positions are opened after the 80th bar closes, on the 81st bar, if the Accelerator Oscillator indicator values are above zero level.
This strategy is often positioned as a very simple and profitable, it is not even supposed to use stop-loss. But in reality it is impossible to apply it without trading experience, without the support of other instruments. Accelerator Oscillator gives insufficient information for a full-fledged strategy.
Conclusions
The Accelerator Oscillator can be used with any asset and on any timeframe. It is leading and gives simple, clear to understand signals and quite strong. Its disadvantages are that it is practically inapplicable without other indicators and gives few signals, so its capabilities are limited. But as an additional, Accelerator Oscillator can be used very effectively in many strategies.
