Adaptive 5-Minute Strategy for Binary Options
There are several optimal patterns expiry dates. One of them is 5 minute intervalas well as 1-minute. This term of trade contracts is most popular with modern traders on online platforms. It allows you to save time by getting a sufficient amount of accurate signals.
Contents
In this article, we will look at a 5-minute strategy on the minute chart with two indicators called “Squeeze”. To trade on this system, you will need a platform for tehancial analysis from TradingViewas well as any trading terminalthat supports these expiry times. We recommend to choose broker INTRADE.BAR – is a reliable, time-proven company offering favorable conditions for beginners and experienced traders.
Information about indicators
The strategy is based on two tools – MESA Adaptive Moving Average and TTM Squeeze. Both indicators are custom development, modified by advanced traders from the TradingView portal. Let’s take a closer look at each tool.
MESA Adaptive Moving Average (based on AMA) – A moving average that works according to the “ratchet” principle. The Internet explains in detail the formulas by which the calculation is carried out. However, in this article, we are not going to dive into mathematics, and directly proceed to practice. The distinction of this type of Moving Average from hundreds of others is that it has a unique approach to the averaging adjusting to the amplitude price formation. As a result, when the price makes a sharp jump, the averaging increases, and when the momentum fades, the MA becomes more receptive. It sort of adapts to any market conditions. Hence its name.
This strategy uses an adapted version of the indicator, slightly improved by the trader known on the TradingView portal with the nickname “LazyBear”. On our website we have already considered more than one strategy using designs of this user. His tools are very popular and are at the top of the custom development rankings for Live graphics.
TTM Squeeze – a tool for determining the level of volatility. Created by John Carter. The principle of action is more similar to oscillatorbut with elements of a trend analyzer. In the classical form it is represented in the form of a histogram. The interpretation of signals of this tool is standard, as well as other histogram indicators, including MACD or Awesome Oscillator From Bill Williams.
Setting up the terminal and platform for analysis
Trading with this system requires a professional level platform. The standard web terminal with its functionality is no longer enough. We will use a very well-known service – Live-chart Trading View. This is an online chart, where many thousands of different indicators are available, and if you want you can develop your own unique tool and submit it to the community of traders for evaluation. This is a unique platform of its kind, which has no analogues.
Step-by-step instructions:
- Open the TradingView portal and log in or create an account if you don’t have one yet. It’s free of charge. You do not need a paid subscription to use the necessary basic functionality.
- We open the chart and choose the asset we are going to trade. An infallible option would be EUR/USD. Set the price display mode “Japanese candles” and a timeframe of 1 minute.
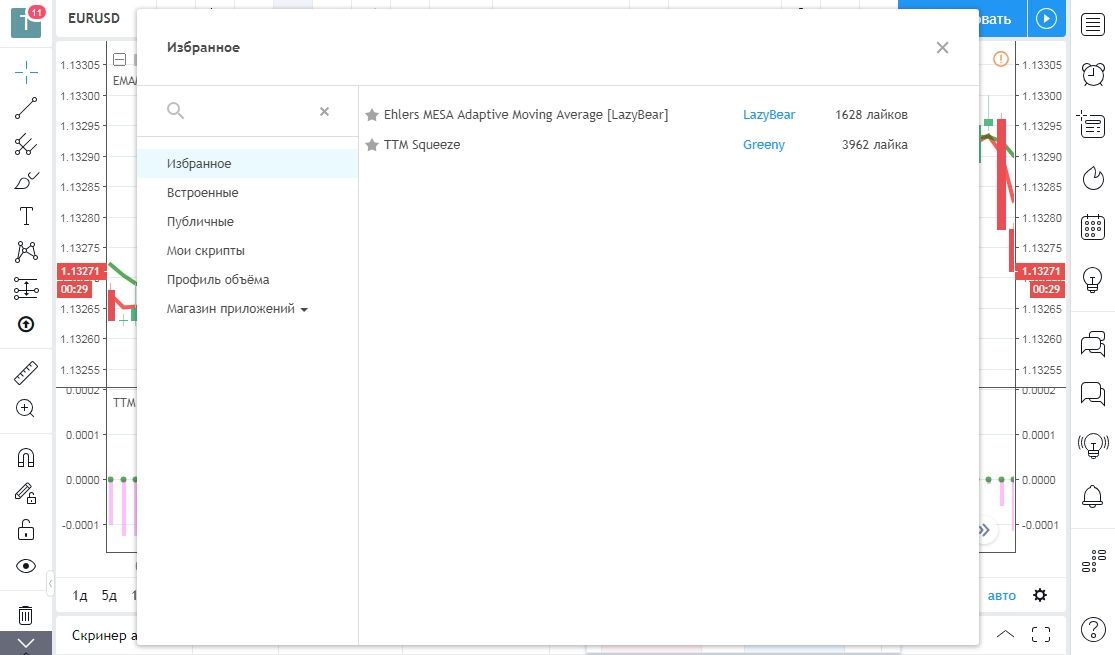
- Using the search, copying the names from the quotes, we add two indicators to the chart: “Ehlers MESA Adaptive Moving Average” and “TTM Squeeze”.
- The settings of the Adaptive Moving Average are left as default, but you can increase the thickness of the curve for easier perception. The TTM Squeeze indicator has a period of 12. The histogram bars can also be set as thick as possible, this will facilitate visual recognition.
Trading signals by strategy
The Adaptive MA consists of two curves of different period, so this indicator gives two signals – crossing the lines and increasing/decreasing distance between them. We are interested in the main signal in the form of crossing muwings. But the distance between them also plays a role in determining the phase of the market.
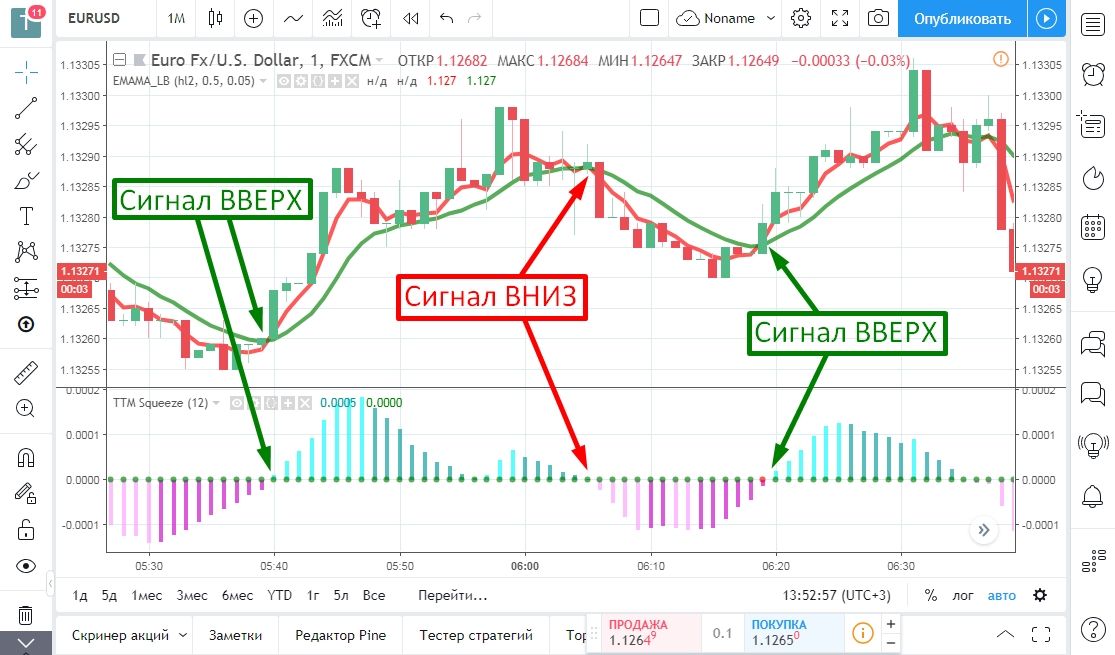
- A signal to go up – red EMA The MA breaks through the green one and rises above it. The TTM Squeeze histogram starts to build above the zero level.
- Down signal – The red EMA MA breaks through the green one, falling down the red line and candlestick formations. The histogram starts to build in the negative plane after the border is broken.
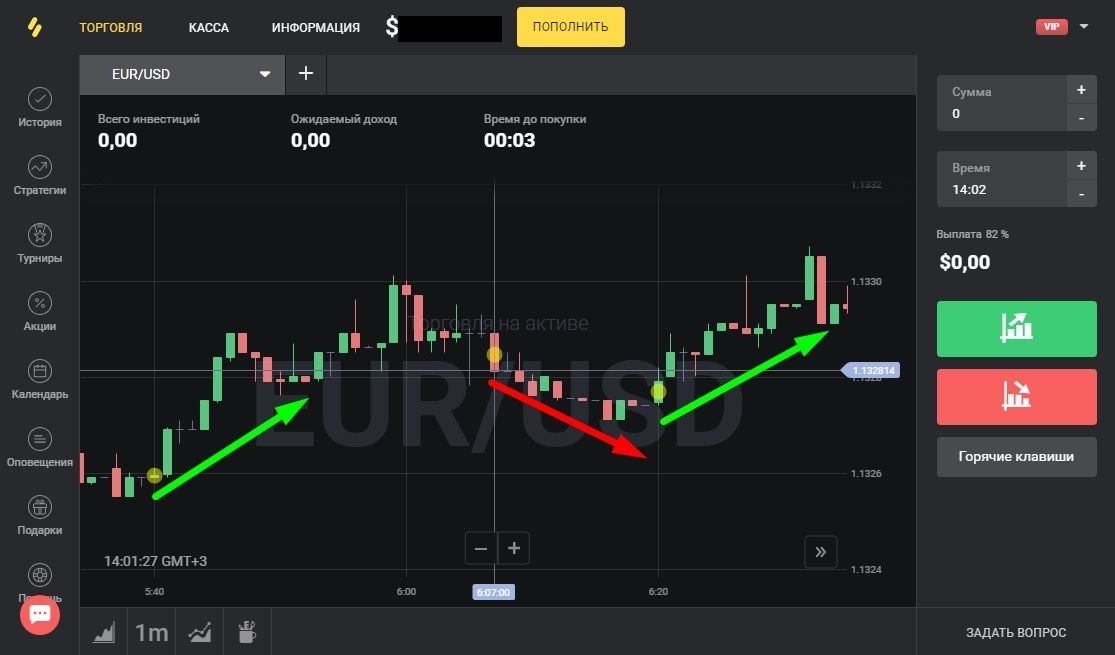
The picture above shows examples of signals on the platform for tehanalysis. They look completely identical in the Intrade.Bar web terminal (Open a demo account).
The ratio of 1-minute timeframe and 5-minute expiration is optimal for these indicators. Most signals in this system allow you to profit within 4-6 price bars after crossing moving averages.
Reviews