Strategy for Live-Charts TradingView “sWalk”
About 70% time the market has no clear direction of movement, it is in a narrow price corridor. This is an unfavorable period for binary options tradingas it is difficult to predict the behavior of the price using the indicators technical analysis. The task of most strategies is the timely recognition of turning points, when one trend stops and the opposite trend starts.
Contents
In this article we will look at strategy “sWalk”, the basis of which is a non-standard user indicator for binary options.
Review of indicators
The system uses two tools – Double Exponential Moving Average (DEMA) and Random Walk Index. The first indicator does not need a separate introduction. This is one of the popular varieties of the simple curve Moving Average. Its difference is the presence of an exponent in the formula and double averaging of the results.
The practical advantage of DEMA is that it is as close as possible to the actual price location graphically. It moves next to the candles most of the time, being at a small distance from them. However, if there is a crossing with the chart, it indicates a change in the trend.
Random Walk Index is an indicator with a more complex multi-level formula. It analyzes data from the chart, determining the nature of the current price movement. The market is a wave-like structure. The most accurate signals are formed at the moment of trend reversals, when there is an “ebb” or “flow”. The RWI clearly shows the nature of the current upward or downward price trend, whether it is a short-term correction, which has no fundamental basis for the continuation of a long movement, or whether it is a powerful trend movement, which balances out the reverse trend in the past.
Preparing terminals for market analysis
Technical analysis strategies in most cases are not tied to a specific trading platform. They use standard functionality and binary options oscillatorsavailable on various services. The “sWalk” strategy is based on tools from the portal’s user catalog TradingView. Therefore, for technical analysis we use “live schedule”And you can trade on any of our platforms rating of reliable brokers. For beginners we recommend PocketOption (site) due to the fact that this company is the most adapted for beginner traders (Binary options trading training). But for strategy this question does not play a significant role.
Step-by-step instructions on how to set it up:
- open Live-chart service from TradingView and a trading platform of a brokerage company in your browser;
- select the same asset in both windows, set the interval candlestick chart for 1 minute;
- specify the amount of investment in the trading contract in the amount not more than 5% of the current balance of trading capital;
- We add indicators to the live-chart: “Random Walk Index” and “Double Exponential Moving Average”;
- adjust the DEMA and RWI period to 20, and adjust the appearance, if desired, by increasing the thickness of the lines and making the colors more saturated.
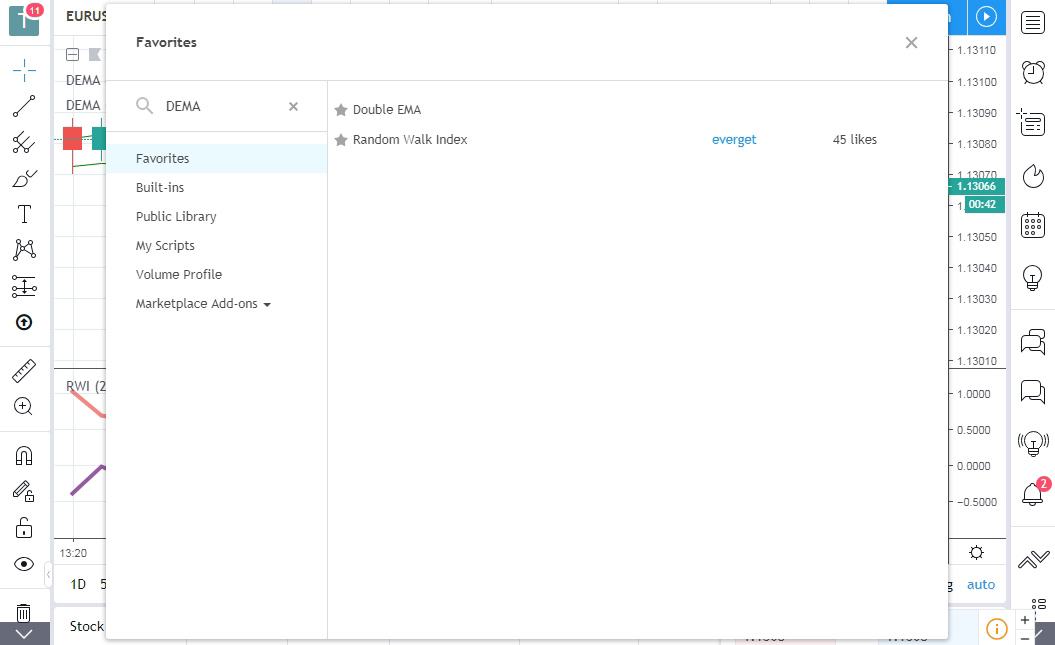
As assets any currency pairs will do. The main criterion is the percentage of profit on the trading platforms. When adding indicators, you can use the search form, inserting the abbreviated names of the instruments: RWI and DEMA, in order not to leaf through the extensive list.
TradingView chart should be opened in one tab, and trading terminal – in the neighboring one. If your computer display is large enough, you can put them side by side. But there is no particular need for that, because trading is done on the 1-minute chart interval, so a high reaction speed, as on the second timeframes, is not required here.
Trading signals strategy
The optimal point to enter the market according to the strategy is the last moment before closing price bar. The live chart displays the time until the current item closes in the right column of the chart, where the current quotes of the asset are indicated. When it is already obvious that the signal is formed and there will be no pullback, you should quickly go to the tab with the trading platform and open a trade.
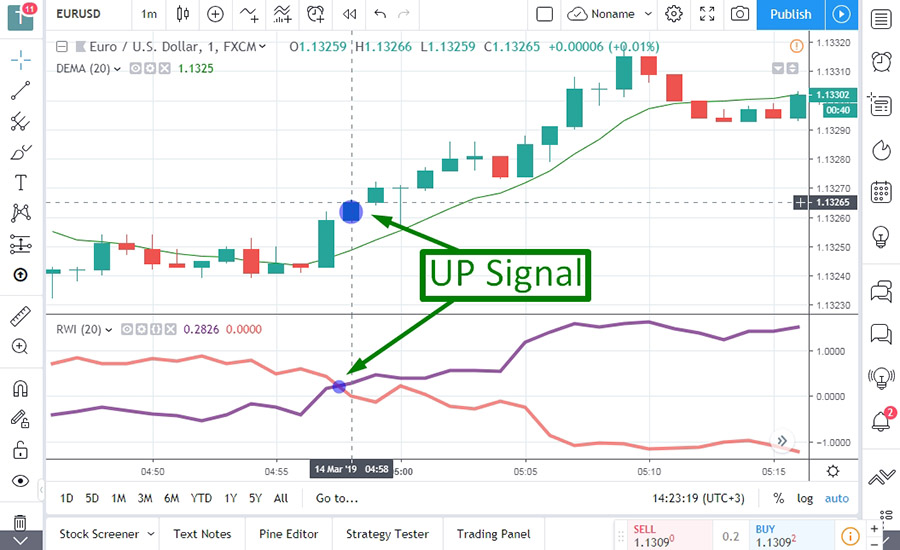
A signal to go up – crossing of the curves of the Random Walk Index with the blue line moving to the top position, as well as the rise of the candles on the chart to a position above DEMA.
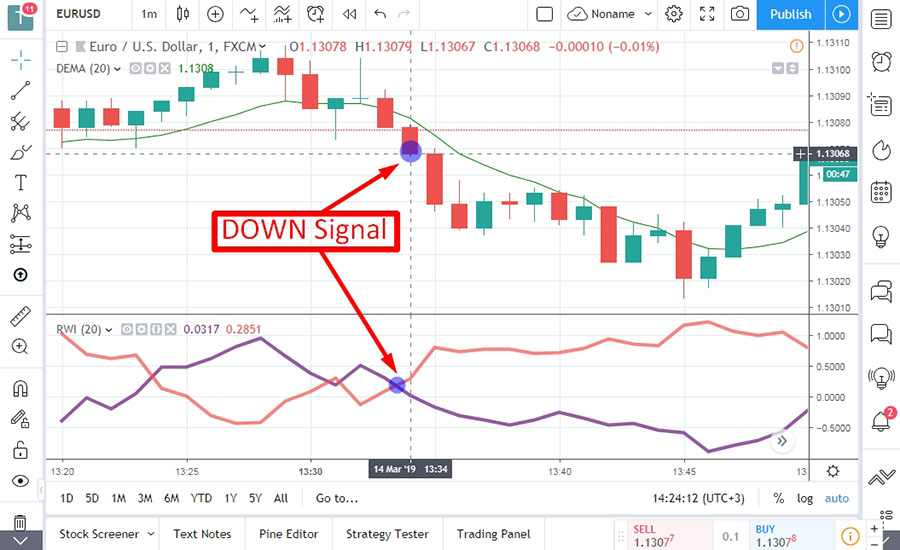
Down signal – exactly the opposite situation. The RWI curves intersect in such a way that the red curve is on top of the blue curve and the price is below the DEMA line on the chart.
Conclusion
The duration of transactions on the strategy should be equal to 5 minutes. If you are trading at pocketoption.com or another company that does not have fixed periods binary options expirationsIt is necessary to remember an important nuance. The 5-minute expirations should be set just before entering the market. Otherwise, the platform automatically resets this indicator to 60 seconds. And the chances of successfully closing a 1-minute deal are significantly lower than the 5-minute deal.


Reviews