A New Look at MACD Divergence
One of the most popular among traders indicators for binary options is MACD. This abbreviation translates as “convergence and divergence Moving averages“. From a technical point of view the tool is quite simple, as they say, everything brilliant is simple.
Contents
The MACD is a multifunctional indicator. It can be used to determine the current phase trendto find the turning points of the market, similar to oscillators for binary optionsas well as recognize the discrepancy. In this article we will look at strategy for PocketOption, which allows for more efficient divergence trading.
What is divergence?
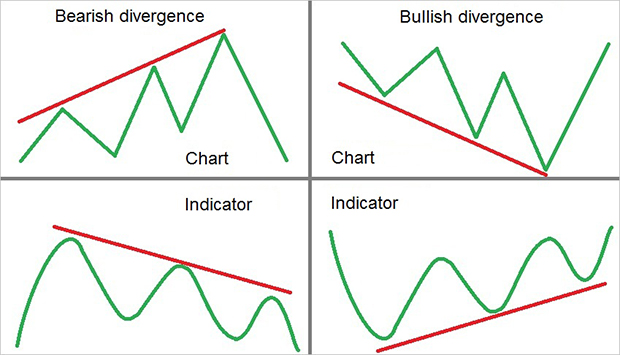
Divergence from English is “divergence, deviation. In the context of binary options trading is a situation when there is a discrepancy between a price chart reading and a trend indicator or oscillator. For example, the price may go upwards and the Moving Averages – downwards. Such situation is formed when the volatility in the market increases sharply, but it is not supported by a sufficient “base”, which in most cases does not allow the price to move within the established trend, so it soon turns around.

The picture above clearly illustrates the essence of the phenomenon of divergence. It can be of 2 types: bearish (downward) and bullish (upward). Let’s consider each of the scenarios in more detail.
- Bearish divergence – the price on the chart is moving within an upward channel. Each successive maximum is a level higher than the previous one. In spite of this, the Moving Averages are moving in the opposite direction – each successive maximum is lower than the previous one. In such a situation, the trader should rely on signals indicator. In more than 70% cases there is a rapid reversal of the uptrend and the beginning of a negative trend.
- Bullish divergence – on the chart, the price is moving downward. The candlesticks describe a wave-like oscillation, each successive low is lower than the previous one by a level. At the same time the MACD or other indicators show an upward trend. In such a situation, the trader should expect an upward price movement soon.
The MACD takes into account a specific period from the chart by calculating its averages. When the market moves too fast, it results in a divergence. However, strong trends do not originate this way. The market should strengthen before the start of the movement. Otherwise, the probability of a quick chart pullback in the opposite direction is high.
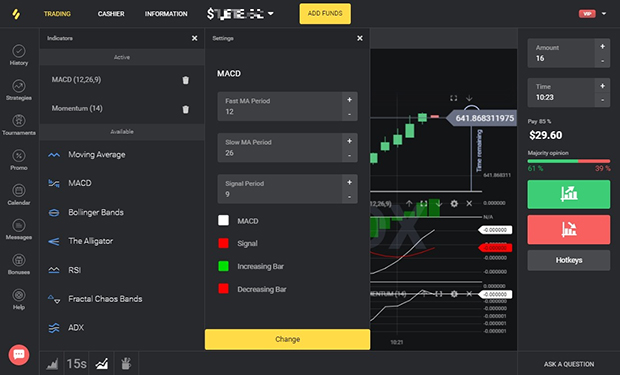
Preparing the PocketOption platform
MACD works on the basis of Moving Averages, which in turn have an averaging formula, calculating the arithmetic average for the period. The vast majority of indicators technical analysis work on the same principle, but there are exceptions. One such solution is Momentum. It is a tool that shows the power of the impulse of the price movement.

Graph settings:
- asset – CRYPTO IDX, if trading on the second chart with an interval of 15 seconds. or any other currency pairs at a timeframe of 30 seconds or more;
- indicators – MACD and Momentum with standard period settings;
- transactions – expiration 4-5 candles taking into account the timeframe, investments – not more than 5% of the balance.
Traders are recommended to use the advantages of the site PocketOption (site), which is focused on short-term trading. Therefore, the optimal choice: asset – CRYPTO IDX, timeframe – 15 sec, expiration of transactions – 1 minute.
Trading signals by strategy
When trading on divergence signals, the trader should be especially attentive, because it will be necessary to recognize minor fluctuations.
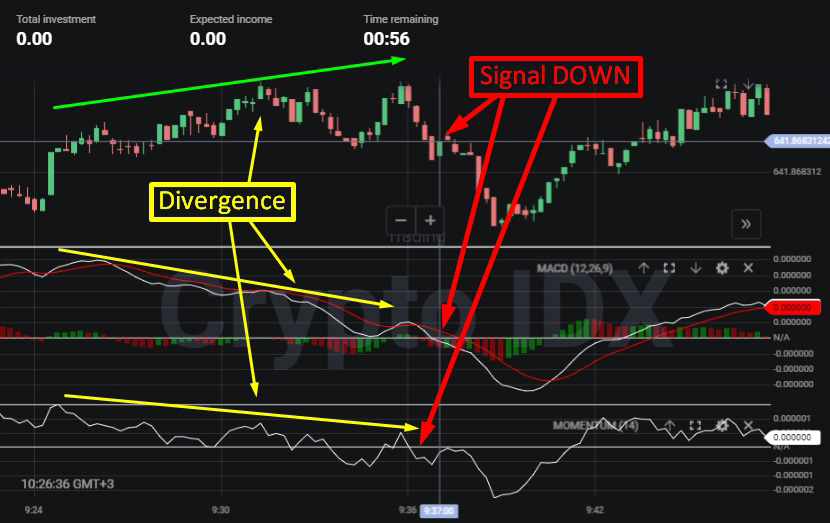
Down signal – 2 price highs are formed on the chart, where the second one is higher than the first one. In the MACD and Momentum window the situation is opposite: the second maximum is lower than the first one. Entering the market takes place after the curves of both indicators overcome the N/A boundary and fall into the lower half of the window.
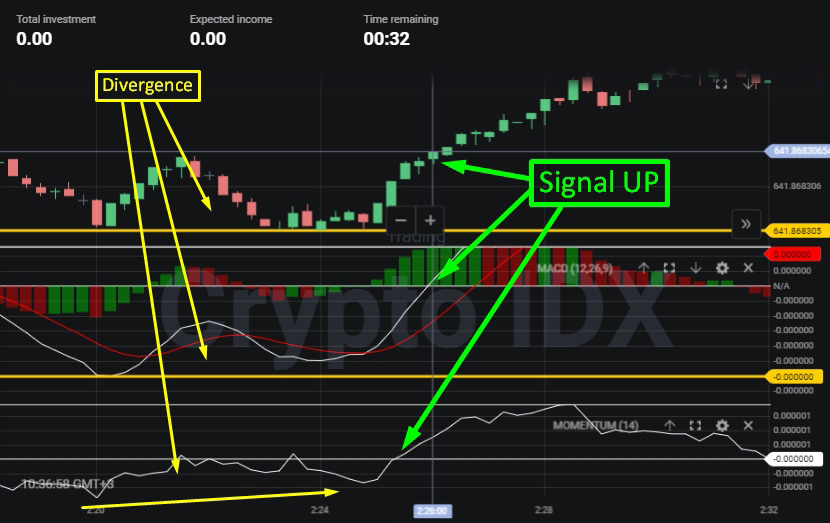
A signal to go up – a downtrend is formed on the chart, while Momentum and MACD show an uptrend. The situation manifests itself with similar signs as in down trading.
Conclusion
The trader should monitor the position of the fast MACD line, which has a white fill color. Often the divergence is faintly visible. In order to recognize it, it is necessary to manually zoom in the window of each of the indicators. The functionality of the broker’s terminal allows not only zooming in the chart elements, but also moving them freely with the mouse.
The vertical scale is adjusted by scrolling in the area of the right vertical scale of the indicator window. For convenience you can use the tool “horizontal line”However, the 15-second timeframe requires a quick reaction. Skipping more than 1 candle after the signal formation significantly reduces the probability of closing the trade with profit.


Reviews