Linear Strategy for 5 Minutes “Colorida”
One of the main advantages of the platform TradingView is a large number of tools for technical analysis. It’s not just about integrated indicators for binary optionssuch as MACD, Moving Average, Bollinger Bands or Alligatorbut also about numerous custom solutions. The catalog has several thousands of all kinds of tools for the analysis.
In this article we will look at strategyThe basis of which is a non-standard modification of the MA – a kind of Alligator, resembling it externally, but working on a different principle. This is “Média Móvel Colorida”. The indicator has not become very popular yet and is not included in the TOP of the most popular developments of TradingView by users. However, this does not mean that it is of low quality. On the contrary, our tests have shown high efficiency of market forecasting. binary options trading in a highly volatile environment.
Setting up the chart and the web terminal
Live-chart TradingView is a convenient and functional service for technical analysis. But it is impossible to trade on it. Transactions should be made in a separate tab of the browser, where the web terminal of any brokerage company is open. If you are already trading on a marketplace, you can open its website. For our part, we recommend newbies PocketOption (site). It is one of today’s leaders in international online options trading. We also advise you to pay attention to the broker Stars Binary (site).
Step-by-step instructions on how to prepare sites for trading on the strategy:
- open two browser tabs – in one – Live-charts from TradingView, in the other – web-terminal PocketOption or another platform Binary options brokerin which you are trading;
- in both tabs set up the charts in an identical way – asset, timeframe for 1 minute, candle mode;
- add two indicators to the TradingView window – “stochastic Relative Strength Index” and Média Móvel Colorida – Color MA;
- adjust the Color MA period to 20 and adapt the appearance to your liking, such as increasing color saturation and line thickness; the parameters oscillator for binary options leave it at the standard value;
- in the tab with the trading platform in advance specify the amount of investment in the transaction. It is recommended – less than 1% if the size of the deposit allows, maximum – up to 5% from balance.
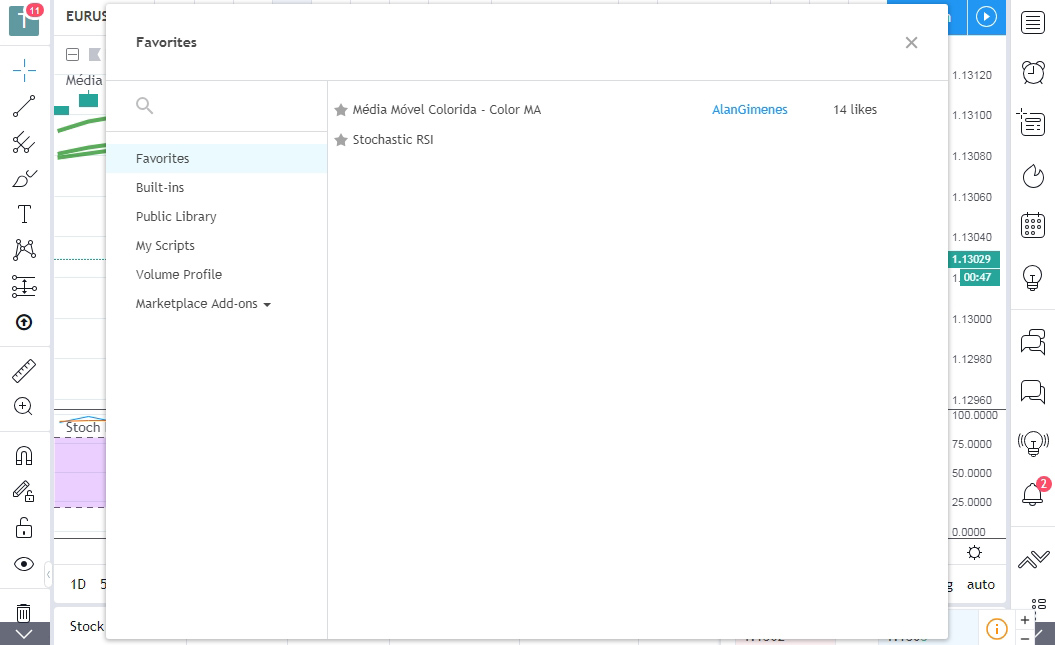
Média Móvel Colorida is a functional indicator that allows you to effectively predict the market in a trend reversal. You should give credit for this to its creator, the portal user with the nickname [AlanGimenes]. However, special symbols are used in its name, so it won’t be so easy to find it in search. To do it you need to insert the keyword “Colorida” and select the appropriate result from the list (see screenshot above). The second indicator can also be found by its abbreviated name – “StochRSI”.
Trading signals by strategy
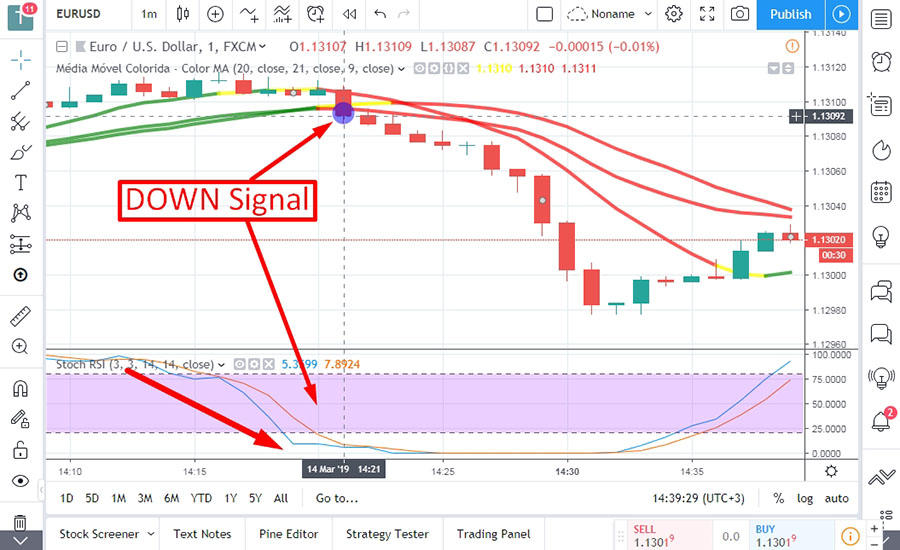
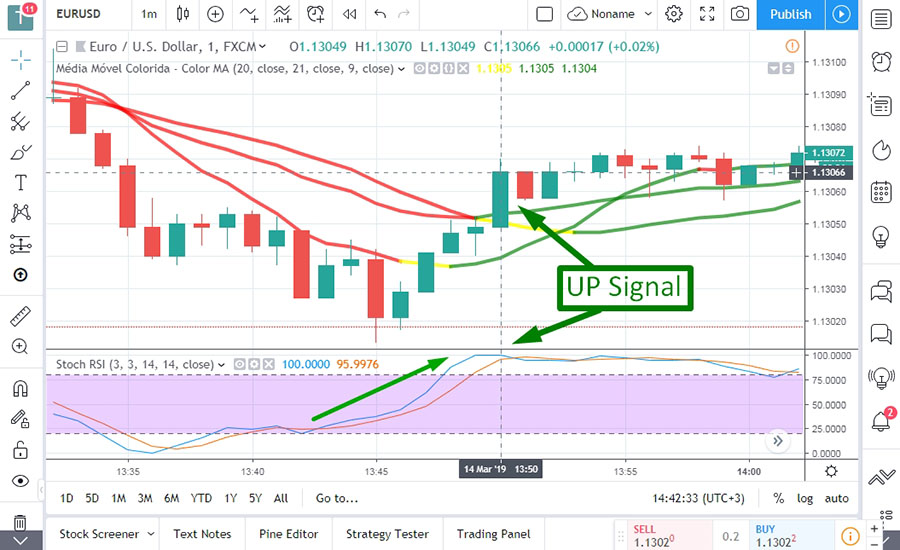
The Color MA indicator has 3 fill colors: red – downward movement, green – upward, yellow – neutral. The interpretation is standard for technical analysis tools. The market entry is carried out after the price overcomes two curves in a row. The same way you can trade, for example, on the Bill Williams’ Alligator or other similar tools with Three Moving Averages.
Down signal – The reversal of the long upward trend. Color MA reacts to this by coloring 2 curves in yellow. Entry into the market occurs as soon as the closing price of the candle will be below the moving average of the indicator. Confirmation signal – the fall of the Stoch RSI oscillator from overbought to oversold.
A signal to go up – The rise of candlesticks on the chart above the 3 curves of the Color MA. Confirmation from the Stoch RSI oscillator – a confident transition of the line from the oversold area (below 20%) to the overbought area (above 80%).
The key success factor in trading with this system is the general state of the market. Too frequent formation of signals (more than 1 time in 20 minutes) in most cases means the activity of a horizontal trend, when to trade on the technical strategies it is impossible. Therefore, beginners should remember a simple rule: transactions can be opened when the indicator signals are formed during the reversal of a strong and prolonged upward or downward trend. Examples of such situations are clearly illustrated in the screenshots above.
Conclusion
You can increase the number of signals on the strategy if you trade on several assets at the same time. PocketOption and many other popular market brokers support multi-mode terminals with independent tabs. For example, you can open several of the most profitable currency pairs, and once every 3-5 minutes check on the TradingView chart to see if the market is preparing for a reversal.


Reviews