How to Analyze Charts and Make Trades on the Pocket Option Platform
Contents
- 1 Basics of the Pocket Option Interface
- 2 Types of Charts on Pocket Option
- 3 Setting Time Intervals
- 4 Technical Analysis Tools
- 5 Charting Tools for Analysis
- 6 Analyzing Market Trends
- 7 Market Entry Strategies
- 8 Risk Management
- 9 Practical Trading Tips
- 10 Utilizing Additional Features of Pocket Option
- 11 Common Mistakes in Chart Analysis and How to Avoid Them
- 12 Conclusion
Pocket Option is a binary options trading platform that has quickly gained popularity among traders due to its user-friendly interface and wide range of trading tools. Regardless of your experience level, mastering chart analysis is a key skill for successful trading on Pocket Option.
Chart analysis allows you to understand current market trends, identify potential entry and exit points, and make informed trading decisions. This is especially crucial in the world of binary options, where the accuracy of your predictions directly impacts the profitability of your trades.
Basics of the Pocket Option Interface
The Pocket Option trading terminal is designed to meet the needs of both beginner and experienced traders. It provides all the necessary tools for analysis and trading in one window.
To start working with charts, you first need to select a trading asset. At the top of the screen, you’ll find a list of available assets, including currency pairs, stocks, indices, and cryptocurrencies. Simply click on the desired asset, and its chart will be displayed in the main part of the screen.
The Pocket Option interface is intuitive but requires some time to master all its features. Let’s explore how to effectively use different types of charts and analysis tools to make informed trading decisions.
Types of Charts on Pocket Option
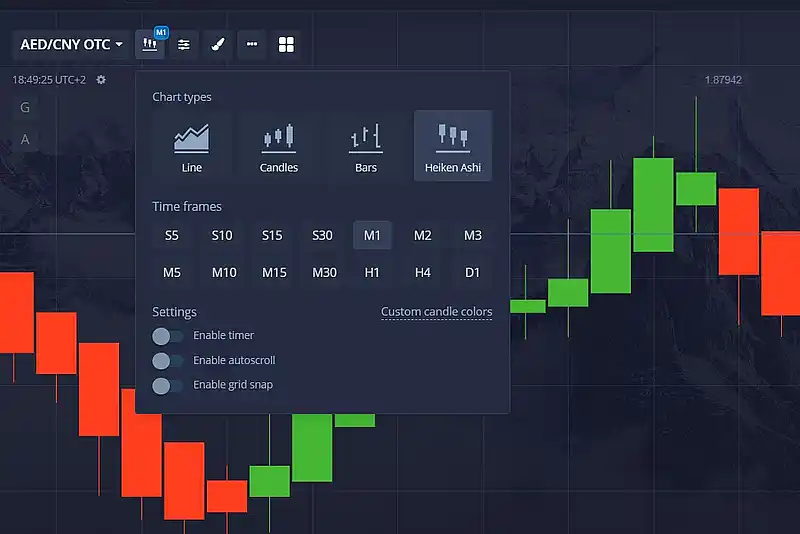
Pocket Option offers several types of charts for analyzing price movements. Each type has its own characteristics and can be useful in different situations. The main types of charts available on the platform include:
- Line Chart: The simplest type of chart, showing a continuous line connecting closing prices over a selected period. Ideal for beginners and for a quick overview of the market trend but provides less information compared to other chart types.
- Candlestick Chart: One of the most popular types among traders. Each “candle” on the chart represents four key prices over a specific period: open, close, high, and low. The color coding of the candles (usually green for rising prices and red for falling prices) allows for a quick assessment of price movement direction. Candlestick charts are particularly useful for identifying reversal patterns and support/resistance levels.
- Bar Chart: Also known as OHLC (Open, High, Low, Close), similar to the candlestick chart but uses vertical lines with horizontal ticks on the left (opening price) and right (closing price). The highest and lowest prices are displayed as the upper and lower points of the vertical line, respectively. This type provides the same information as the candlestick chart but in a more compact form.
- Heiken Ashi. This is a modified version of the candlestick chart that helps smooth out price fluctuations and more clearly identify trends. The name “Heiken Ashi” comes from a Japanese term meaning “average candle.” The Heiken Ashi chart is particularly useful for traders who focus on trend following. It helps filter out market noise and provides a clearer picture of the dominant trend.
How to Switch Between Chart Types:
- Locate the toolbar above the chart.
- Find the chart type selector – usually a button displaying the current chart type.
- Click this button to open a dropdown menu with available chart types.
- Select your desired chart type.
It’s important to experiment with different chart types to find the one that suits your trading style best. Many experienced traders prefer using candlestick charts due to the wealth of information they provide, but the choice is always yours.
Remember, the ability to read and interpret charts is a key skill in trading on Pocket Option. Practice and continuous learning will help you improve your analytical abilities and make more informed trading decisions.
Setting Time Intervals
One of the important aspects of chart analysis on site Pocket Option is choosing the right time interval or timeframe. The platform offers traders a wide range of available timeframes, from ultra-short to long-term.
Available Timeframes:
- 5 seconds
- 15 seconds
- 30 seconds
- 1 minute
- 5 minutes
- 15 minutes
- 30 minutes
- 1 hour
- 4 hours
This range allows traders to analyze both short-term and long-term market movements.
How to Choose the Right Time Interval for Analysis:
- For intraday, short-term trading:
- 5 seconds, 15 seconds, 30 seconds, 1 minute – for ultra-short trades.
- 5 minutes, 15 minutes – for medium-term trades.
- For medium-term and long-term trading:
- 30 minutes, 1 hour – for medium-term analysis.
- 4 hours – for long-term analysis.
Beginner traders should start with longer timeframes, such as 1 hour or 4 hours. This helps to get a general understanding of market trends before moving on to more active, short-term trading.
Additionally, use multiple timeframes simultaneously for a more comprehensive analysis. For example, combine a 15-minute chart to identify short-term signals with a 1-hour chart to understand the broader picture.
Experiment with different timeframes to find the optimal balance between signal accuracy and alignment with your trading style on Pocket Option.
Technical Analysis Tools
The Pocket Option platform provides traders with a wide range of technical analysis tools for a deeper study of price movements and making informed trading decisions.
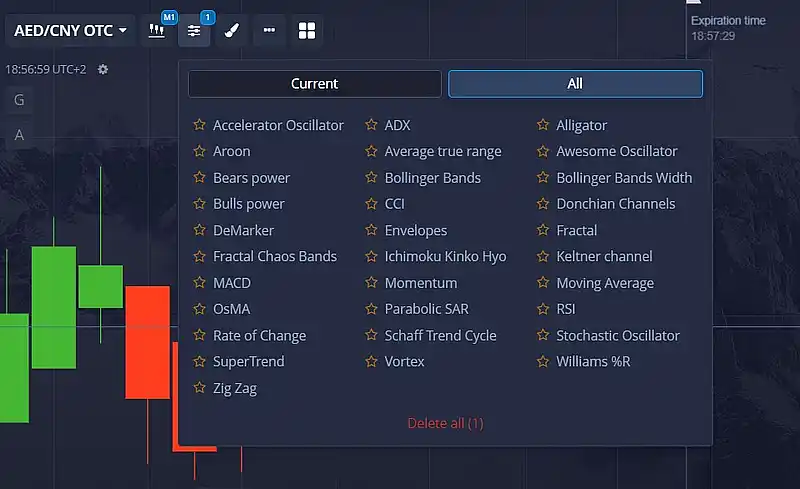
Overview of Available Indicators: On Pocket Option, you can find more than 30 different indicators, including:
- Oscillators: RSI, MACD, Stochastic, CCI.
- Bands: Bollinger Bands, Exponential Moving Averages (EMA).
- Trend Indicators: Moving Average Convergence Divergence (MACD), Average Directional Index (ADX).
- Wave Indicators: Alligator, Awesome Oscillator.
- Volume Indicators: On-Balance Volume (OBV), Money Flow Index (MFI).
This diverse set of indicators allows you to analyze various aspects of market dynamics, including trends, volatility, momentum, and volumes.
How to Add Indicators to a Chart:
- Locate the toolbar above the chart.
- Click on the “Indicators” button.
- In the menu that opens, select the indicator of interest.
- The indicator will be displayed on the chart.
You can easily switch between different indicators to get a better understanding of the current market situation.

Popular Indicators and Their Interpretation:
- RSI (Relative Strength Index): Measures the speed and change of price movements. Used to determine overbought and oversold conditions.
- MACD: Signals are based on the difference between two exponential moving averages. Helps to identify trends and reversal points.
- Bollinger Bands: Shows market volatility. The narrowing of the bands indicates a decrease in volatility, while the expansion indicates an increase.
Studying and correctly interpreting these and other indicators on Pocket Option will allow you to more accurately identify market entry and exit points, which in turn will increase the profitability of your trades.
Don’t forget that technical analysis is an art that requires practice. Experiment with different indicators to find the most effective solutions for your trading strategy.
Charting Tools for Analysis
In addition to indicators, the Pocket Option platform offers traders a range of charting tools that can significantly enhance their analytical capabilities.
Trend Lines: Trend lines are one of the most common charting tools. These are diagonal lines connecting the lows (uptrend) or highs (downtrend) on a chart. These lines help to visually identify the direction of the main trend and its changes.
Support and Resistance Levels: Support and resistance levels are horizontal lines marking price areas where the market usually changes its direction. Support levels are prices below which the market cannot hold, while resistance levels are prices above which the market finds it difficult to break through. Identifying and using these key levels is an important element of technical analysis.
Technical Analysis Patterns: On Pocket Option charts, you can recognize various technical analysis patterns, such as:
- Triangles (symmetrical, ascending, descending).
- Flags and pennants.
- Head and Shoulders.
- Double and triple tops/bottoms.
These chart patterns help to identify reversal points and the direction of future price movement.
Analyzing Market Trends
Understanding general market trends is a key element of successful trading on Pocket Option. By using various charting tools, traders can identify and evaluate current trends, as well as determine key support and resistance levels.
Determining the Trend: Identifying the presence and direction of the main trend is crucial in technical analysis. This can be done using trend lines, moving averages, and other trend indicators. Understanding the current trend allows for more informed trading decisions.
Identifying Key Levels: Recognizing support and resistance levels provides an opportunity to determine areas where the market may reverse or consolidate. These key levels serve as reference points for market entry and risk management.
Using charting tools together with market trend analysis on Pocket Option allows traders to create higher-quality trading plans and make informed decisions. Continuous practice and skill improvement in technical analysis are key to successful trading on the platform.
Market Entry Strategies
Successful trading on the Pocket Option platform requires well-developed market entry strategies. Choosing the right moment to enter a trade can significantly increase the chances of a successful outcome. Below are some key approaches to selecting optimal entry points.
Breakout Trading
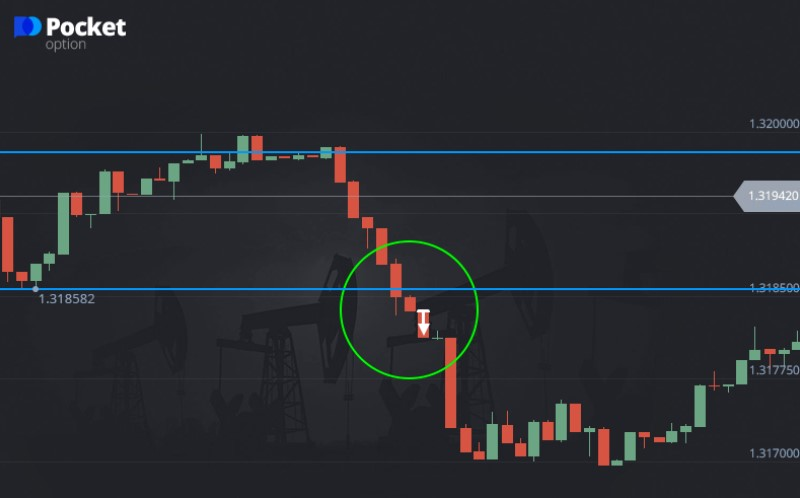
Breakout trading involves opening a position when the price breaks through a certain level that previously acted as support or resistance. This approach is based on the idea that when a significant level is broken, the price usually continues to move in the direction of the breakout.
To successfully trade breakouts, it’s essential to identify key support and resistance levels on the chart. When resistance is broken, it is recommended to open a buy position, and when support is broken, a sell position. It’s important to consider trading volume: a high volume at the breakout confirms the strength of the signal.
Example: If the price has tested a resistance level several times and finally breaks through on high volume, this could indicate a strong upward trend.

Rebound from Levels
The rebound from levels is a strategy where trades are opened based on the assumption that the price will bounce off a key support or resistance level. This method is ideal for traders who prefer to trade within a range rather than waiting for a breakout.
For this strategy to be effective, it’s important to accurately determine the support and resistance levels on the chart. When the price reaches one of these levels and starts to bounce, you can consider opening a trade in the direction opposite to the movement toward the level.
Example: If the price approaches a support level and begins to show signs of reversal, this may be a signal to buy with the goal of profiting from the rebound.
Trend Following
Trend following is one of the most popular strategies among traders. It is based on the assumption that the current market trend will continue for some time. The trader’s main task is to identify the trend and open trades in its direction.
Various tools can be used to identify trends, such as moving averages, trend lines, and trend indicators (e.g., MACD). After opening a position in the direction of the trend, traders often hold it until signs of its end or reversal appear.
Example: If the chart shows a clear uptrend, traders may open buy trades on pullbacks, following the trend and minimizing risks.
Risk Management
Effective risk management is an integral part of successful trading on Pocket Option. Even the most accurate forecasts and strategies can fail due to unexpected market changes, so it’s important to always protect your investments and minimize potential losses.
Setting Stop-Loss and Take-Profit
Stop-loss and take-profit are two key risk management tools that allow traders to automatically close trades when a certain level of loss or profit is reached.
A stop-loss is set at a level where the trader is willing to accept losses. This tool protects against significant losses in case the market moves in an unfavorable direction. The stop-loss should be set considering the asset’s volatility and the level of risk the trader is willing to take.
Take-profit is intended to automatically lock in profits when the price reaches a pre-set level. This helps avoid situations where a profitable trade turns into a losing one due to a market reversal.
Example: If you open a buy trade, set the stop-loss slightly below the last low, and the take-profit at a key resistance level.
Determining the Optimal Position Size
Position size refers to the amount of assets a trader buys or sells in a single trade. Determining the optimal position size is important for controlling risk and maximizing profits.
The main rule is not to risk too much of your capital in a single trade. It is recommended to use no more than 1-2% of your total capital per trade to minimize losses in case of an unfavorable outcome.
Example: If your capital is $1,000, and you are willing to risk 2% per trade, with a risk of $10 per trade, the position size will be 20 contracts or units of the asset.
These strategies and tools will help you trade more confidently on the Pocket Option platform and effectively manage risks.
Practical Trading Tips
Trading on the Pocket Option platform requires attention and the right approach. To increase your chances of successful trading, it’s important to follow several key steps, from opening a trade to monitoring positions.
How to Open a Trade on Pocket Option
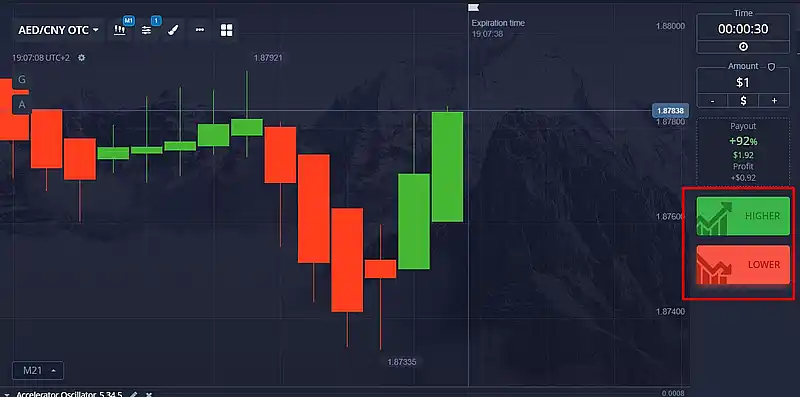
Opening a trade on Pocket Option starts with selecting the asset you want to trade. This can be a currency pair, stock, index, or cryptocurrency. After choosing the asset, set the amount you are willing to invest and decide in which direction you believe the price will move: up or down. Use the “Higher” or “Lower” buttons for this. Once you confirm the chosen parameters, the trade will be activated, and you can immediately monitor its results.
Choosing the Expiration Time
The option expiration time is when the trade automatically closes, and the result is recorded. Choosing the expiration time plays a crucial role in your trading strategy. If you prefer short-term trading, select shorter time intervals, such as 1 or 5 minutes. For long-term strategies, an expiration time of 15 minutes or more is better suited. The ability to correctly choose the option expiration time can significantly increase your chances of a successful trade.
Monitoring Open Positions
After opening a trade, don’t forget to regularly check its status. In the “Open Positions” section of the Pocket Option platform, you can observe the asset’s price changes as well as the current profit or loss. If the market situation changes, you may decide to close the trade early to minimize risks, or conversely, leave it open until completion. Constant monitoring will help you respond quickly to changes and make informed trading decisions.
Utilizing Additional Features of Pocket Option
The Pocket Option platform offers traders not only standard tools for chart analysis and executing trades but also a range of additional features that can significantly enhance the trading experience and potentially increase profitability. These features are designed to help traders of all skill levels make more informed decisions and manage their positions more effectively. Two key additional features available on the platform are social trading and trading signals.
Social Trading
Pocket Option provides a social trading feature that allows traders to copy the trades of successful platform participants. This is particularly useful for beginners who can learn from the experience of more seasoned traders. However, even when copying trades, it’s important to understand the market situation and not neglect risk management.
Trading Signals
The platform offers trading signals that can assist in decision-making. These signals are based on various indicators and may point to potential entry points in the market. However, you should not rely solely on signals—use them in combination with your own analysis.
Common Mistakes in Chart Analysis and How to Avoid Them
Even experienced traders can make mistakes when analyzing charts, which can lead to incorrect trading decisions and financial losses. Understanding and avoiding these common mistakes is a key factor in improving your trading efficiency on Pocket Option. The most common mistakes and ways to prevent them include:
- Overloading the Chart with Indicators: Use a limited number of indicators to avoid conflicting signals.
- Ignoring the Overall Trend: Always consider the long-term trend when making short-term decisions.
- Neglecting Risk Management: Set stop-losses and avoid risking a large percentage of your capital on a single trade.
- Emotional Trading: Stick to your trading plan and don’t let emotions influence your decisions.
Conclusion
Choosing the right type of chart and time frame lays the foundation for effective market movement analysis. Using technical indicators and charting tools, such as trendlines and support and resistance levels, helps traders make more informed decisions.
Special attention should be given to identifying the overall trend and key price levels, as these are the basics of technical analysis, allowing for more accurate market forecasts. The additional features of Pocket Option can be valuable tools in a trader’s arsenal, but they should be used cautiously and in conjunction with your own analysis.
To improve your skills, it’s advisable to regularly practice chart analysis on a demo account. This allows you to experiment with different strategies and tools without the risk of losing real funds.


Reviews