Trend-Based Trading: How to Recognize and Use Different Strategies
Contents
Trend-based trading is one of the most common approaches in financial markets. A trend represents the general direction of an asset’s price movement in the market over a certain period of time. The importance of recognizing and confirming a trend is that it allows traders to identify the most likely direction of price movement and make appropriate trading decisions.

How to recognize and confirm a trend in the market
There are different ways to recognize a trend. Two options are most commonly used.
Using charts to determine the trend
The most common tool for visualizing price movements in the market is charts. There are several types, but the most popular ones are line, candlestick and bar charts. Each of them provides information about the price of an asset in different time periods and helps to identify trend characteristics.
Line graphs
The simplest type, which is a line connecting the prices of an asset in the market at certain points in time. This chart allows you to see the general trend of price movement, but does not provide detailed information about volatility or maximum/minimum values.
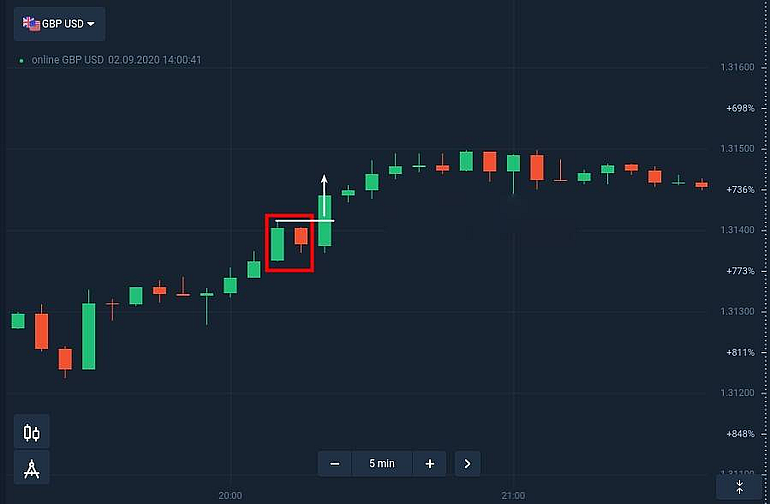
Candlestick charts
Each candlestick is a rectangle, called the body, which shows the range between the opening and closing prices of the asset in a certain period of time. The chart also shows the tendrils, which are the maximum and minimum price values for that period. The color of the candlestick body depends on whether the price closed above or below the opening, which helps to visually determine the direction of the trend.
Bar charts
Provide information similar to that given as candlestick charts, but in a different format. Each bar is a vertical line with a horizontal line to its left and right. The line on the left shows the opening price and the line on the right shows the closing price. The horizontal lines represent the maximum and minimum price values for a given period.
Technical indicators
There are also several indicators that help confirm the trend.
Moving averages
Moving averages (MA) – one of the most popular and widely used technical indicators to determine the trend in the market. It strokes the fluctuations of the price chart, creating an average price over a certain period of time. Depending on the timeframe and type of moving average (such as simple or exponential), it can help identify long-term or short-term trends.
Simple Moving Average (SMA) is calculated by summing the closing prices for a certain period and dividing by the number of periods. This type reacts more slowly to price changes and is used to determine long-term trends.
Exponential Moving Average (EMA) also takes into account recent prices more strongly, making it more sensitive to recent price changes. EMA is suitable for determining short-term trends and reacts quickly to changes in the market.
Directional Movement Indicators (DMI)
Directional indicators such as ADX (Average Directional Index) help determine the strength and direction of a trend. ADX measures the degree to which price is moving in a particular direction and ranges from 0 to 100. An ADX value above 25 is generally considered a signal of a strong trend, while values below 20 indicate no clear trend.
Parabolic SAR system
SAR (Stop and Reverse) is a technical indicator that can also help to determine the direction of the trend and the moment of its change. SAR is a series of dots that are placed above or below the price bars. If the price crosses the SAR, it may signal a trend change.
When confirming a trend in the market, traders usually combine various technical indicators to improve forecasting accuracy. For example, using moving averages in conjunction with directional indicators can provide a more reliable indication of trend direction and strength. But it is important to remember that no indicator is perfect, and traders should always perform additional analysis and consider a combination of factors before deciding whether to enter a trade.

Trend direction trading strategies
Traders most often use several strategies. Let’s tell you about them in detail.
Consecutive new highs/minimums
This is one of the most popular and simple strategies, which is based on identifying and confirming a trend by observing successive setups of new highs or lows on the price chart. Entering a trade based on new highs/minimums:
Detecting Trend Establishment: Before applying this strategy, it is necessary to verify that the market is in a trend, either up or down. This can be done by using the technical indicators described in the previous section or by analyzing the chart for consistent high (for an uptrend) or low (for a downtrend) price values.
Entering a position. After confirming the presence of a trend, the trader looks for the moment when the price forms a new high (for an uptrend) or low (for a downtrend). Entry into a position is made at the close of a candle that exceeds the previous high (low) or in the presence of other confirming signals (e.g. indicators or patterns).
Setting stop losses and profit levels:
- Stop Loss. When applying the strategy, setting a stop loss is essential for risk control. A stop loss should be placed below the last low (for an uptrend) or above (for a downtrend) to protect capital from large losses in the event of a trend change.
- Profit levels. To lock in profits, a trader can use different methods to set profit levels. Some prefer a fixed profit level in pips or percentage of the entry price, others use technical indicators or support/resistance levels to determine the exit of a position.
Kickback strategy
This is an effective trading method based on the idea that prices in the market often experience corrections in the direction of a major trend before continuing in the same direction. This strategy allows traders to enter a position at a more favorable level after an intra-trend correction. Trading on corrections in the direction of a trend:
- Trend Identification. As in the previous strategy, the first step is to determine the presence and direction of the main trend. This can be done by using technical indicators or analyzing the chart for consecutive highs and lows.
- Definition of correction. After identifying the main trend, traders start looking for signals of correction, i.e. a temporary change in the direction of price movement in the direction opposite to the main trend. Corrections can be identified using indicators such as RSI (Relative Strength Index), stochastic oscillator or other means of market analysis.
Use of support and resistance levels:
- Searching for levels. A support level is a price level at which the price drop is expected to stop and a possible upward trend recovery is expected. At the resistance level the upward movement is expected to stop and a possible recovery of the downward trend is expected.
- Position Entry. When price is at a support level (in an uptrend) or resistance level (in a downtrend) and signals a change in direction, traders can enter a position in the direction of the main trend. This can be done at the close of a candle that exceeds the support or resistance level, or after receiving confirming signals from other indicators.
The “Pullbacks” strategy allows traders to catch favorable moments to enter a position after a correction in the direction of the trend. But it is important to remember that corrections can be unpredictable, and you should always set stop losses to protect your capital from unexpected market movements.

Moving Average Strategy
A trend strategy based on moving averages is a popular approach to trading in the direction of a trend. Moving averages (MAs) are used to smooth price data and identify the overall trend in the market. Two types of moving average crossovers are considered in this strategy: the golden crossover and the death crossover.
Golden crossover strategy
The strategy is based on the intersection of two moving averages. This strategy uses two moving averages of different periods, for example, a 50-period CC and a 200-period CC. When the shorter period CC (50-period) crosses the longer period CC (200-period) from top to bottom, it is considered a sell signal, which may indicate a possible trend change from upward to downward. Conversely, when the 50-period SS crosses the 200-period SS from the top to the bottom, it is considered a buy signal, which may indicate a possible change in trend from a downtrend to an uptrend.
The “deadly intersection” strategy
This strategy is the opposite of the previous one. It also uses two moving averages of different periods, and signals to enter a position are generated when they cross. When a shorter period CC crosses a longer period CC from the bottom up, it is considered a buy signal, which may indicate a possible change of trend from downtrend to uptrend. Similarly, when a 50-period SS crosses a 200-period SS from bottom to top, it is considered a sell signal, which may indicate a possible change from an uptrend to a downtrend.
Traders often use these strategies to identify entry points into positions and confirm a trend in the market. They are considered simple and effective, especially for traders who follow long-term trends. But it should be noted that moving averages can give false signals during periods of sideways market movement, so it is recommended to use them in conjunction with other technical indicators and analysis tools to improve the accuracy of trend forecasting.
Reviews