15 Minutes RSI Divergence Trading Strategy
Divergence is a situation where oscillators or trending indicators show the market moving in one direction, but in fact on the chart it is headed in the opposite direction. In 75% cases, when a divergence is formed, the market quickly reverses and begins to directional trend, synchronous with the averaging indicators. It can be recognized either manually by visual analysis or with the help of special indicators.
Contents
In this article we will look at 15 minute strategywhich is based on a custom tool that shows divergences in the window RSI Relative Strength Index.
Information on the strategy
RSI Divergence – a tool based on the Relative Strength Index, which automatically recognizes the phenomenon of divergence and underlines it with a change of color. Otherwise it has identical functionality to the classic version of the RSI. It also consists of a single curve line.
MACDAS – MACD modification with a reduced averaging period and increased sensitivity. In the instrument card on the website TradingView The developer makes a visual comparison of his brainchild with the original version. It shows a significant difference in terms of lag reduction. The interface remains standard, except for the missing histogram.
Preparing for trading
At once we open two browser tabs. The first one is the PocketOption web terminal (open) or another platform for “High/Low” contracts for 15 minutes, and in the second – the service Live-chart from TradingView (open). The latter requires registration, but it is free and takes very little time.
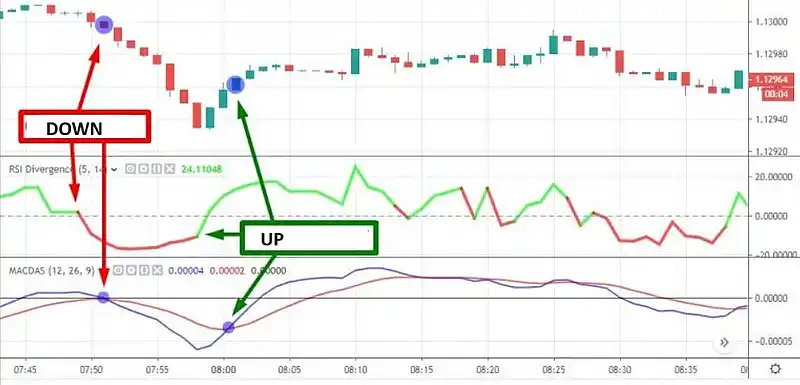
Select the most profitable asset from the list of available ones in the trading platform window. Open it on a 1-minute candlestick chart. The same work is done in the live chart window. Then we add two indicators to the Live chart – “RSI Divergence” and “MACDAS”. We copy the names into the search without the quotes, or enter them manually. Select the options shown in the illustration above – see the developer logins highlighted in blue.
Technical details of the system
Money Management. The level of risk directly depends on the amount of investment, the percentage relative to the balance of the deposit. The minimum risk – from 0.5% and less. The average – up to 2%, and high – up to 5% and above. However, it is strongly not recommended to go beyond 1/20 of the deposit. Unless, of course, your goal is to maximize your deposit or you take part in traders’ tournaments (the latter are regularly held by the International Monetary Fund). PocketOption broker).
Expiration dates. 15-minute trades with fixed profits are used. It is possible to increase the expiry time up to 1 hour if the analysis is carried out on the 5-minute chart.
Trading asset and time. Well suited currency pairs with EUR, CHF, GBP and other European currencies paired with the dollar. Optimal time for trading – from 15 to 21 hours, Moscow time. For the Japanese Yen, Australian and New Zealand Dollars, the morning interval is more suitable. This is due to the schedule of trading sessions.
Signals for trading on the system
Evaluation trading signals is made taking into account the position of the lines in the overbought and oversold zones, as well as their color. The frequency of reversal also matters. The optimal frequency of signal formation is 1 time per 15-20 minutes.

- The deal “Down”. The signal is formed on the background of an uptrend reversal with the appearance of divergence. RSI Divergence should change the fill color from green to red, being in the upper half of the window. At the same time, a convergence of MACDAS curves should be formed, after which the red curve takes the leading position relative to the blue one.
- The deal is “UP”. The color of the RSI Divergency line changes from red to green. The MACDAS indicator in this case should show the beginning of an uptrend movement. The red line, which symbolizes the downtrend, should fall below the blue curve after crossing it.
We emphasize the importance that both indicators must be in the appropriate half of the window. For example, you cannot trade up if the RSI curve color change or MACDAS crossing occurred in an overbought zone (the upper half of the window, above the zero line).
Conclusion
As in other similar strategies, the rule that too frequent formation of reversal signals is an unfavorable sign applies here. A typical example of such a situation is the TradingView chart shot above. It clearly shows that MACDAS curves practically merge a few minutes after the breakthrough signals have been formed, while RSI Divergency demonstrates frequent changes of tendencies. This is how a horizontal price movement manifests itself, which should be waited out. It is also possible to simply change the traded asset to any other option with a low degree of correlation.
Reviews