Current Indicators and Oscillators to Work in the Forex Market
It is difficult to count the number of methods of trading in financial markets, but professionals agree on one thing – trading becomes more successful when using proven indicators and oscillators. In this article, with the support of the broker NPBFX (go online), let’s break down the most relevant ones.
Contents
What are forex indicators?
We should start with the theoretical component: what does the term “forex indicators”. These are mathematical analysis tools that can graphically reflect market signals. Using indicators, a trader can accurately and quickly analyze the price movement of an asset, and thus determine the strength and direction of the asset movement more reliably. The peculiarity of indicator analysis is the use of two or more indicators for making the right forecasts. Two types of indicators are popular among experienced traders: trend indicators and oscillators.
- Trend indicators indicate specifically the direction of the movement – whether it will be downward or upward, and the trend reversal points.
- Oscillators are aimed at demonstrating the deviation of the asset price from the average value, provide entry signals based on the overbought or oversold condition of the asset. Oscillators are also considered to be leading indicators. These indicators determine the moment of a trend reversal, they can find profits even in a flat market.
Each of these indicators is informative in its own situation, trend indicators – in the presence of a pronounced trend, oscillators – in its absence (forex oscillators). Let’s take a closer look at the three most popular and useful indicators in the forex market.
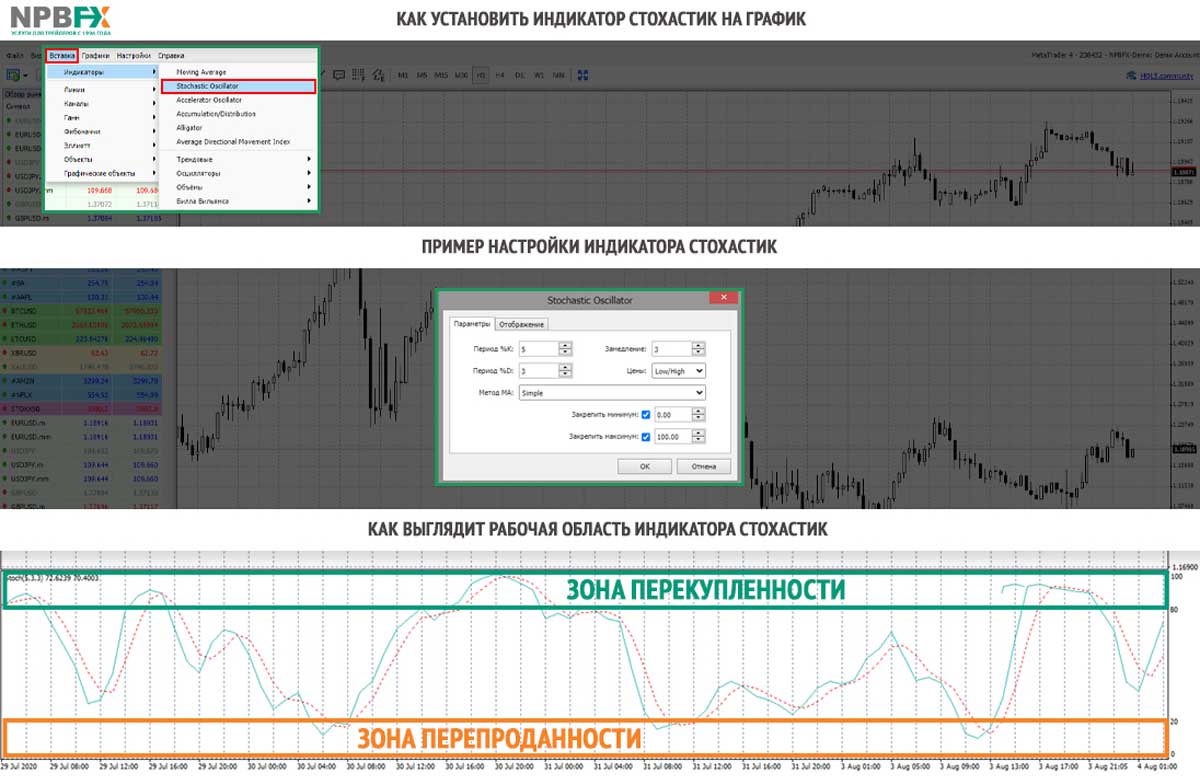
Stochastic indicator
Stochastic is one of the most popular indicators among traders of different level of training, for many years it has not lost its relevance. It indicates that the Stochastic is overbought or oversold in the market, signaling the probable decrease in prices for a correction or the approaching rebound. Stochastic consists of two lines (Moving Average and Ratio line), moving and interacting with each other. Conventionally, when added to the chart Stochastic indicator divides it into two zones, the upper one is overbought, the lower one is oversold. The case when both lines enter one of the areas is a signal.
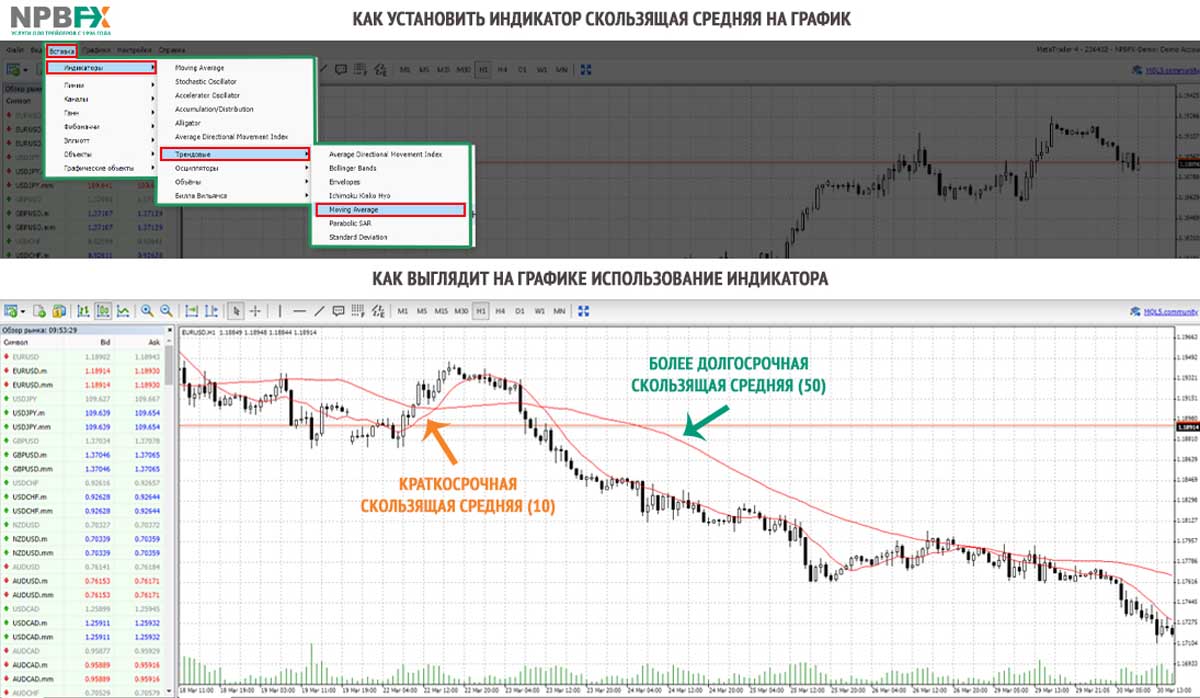
Simple Moving Average (SMA) indicator
This indicator is the arithmetic average of the price for the period. The average is used to soften the price movements for a more accurate determination of the trend. SMA is rarely used as a single indicator because it works best as a confirmation of a trend rather than as a qualitative detection of it. How do moving averages work? The signal of a new trend appears when a short-term moving average crosses a long-term moving average:
- Crossing from the bottom up the short-term moving average long-term – an uptrend.
- The intersection of the short-term average from the top down with the long-term – a downtrend.
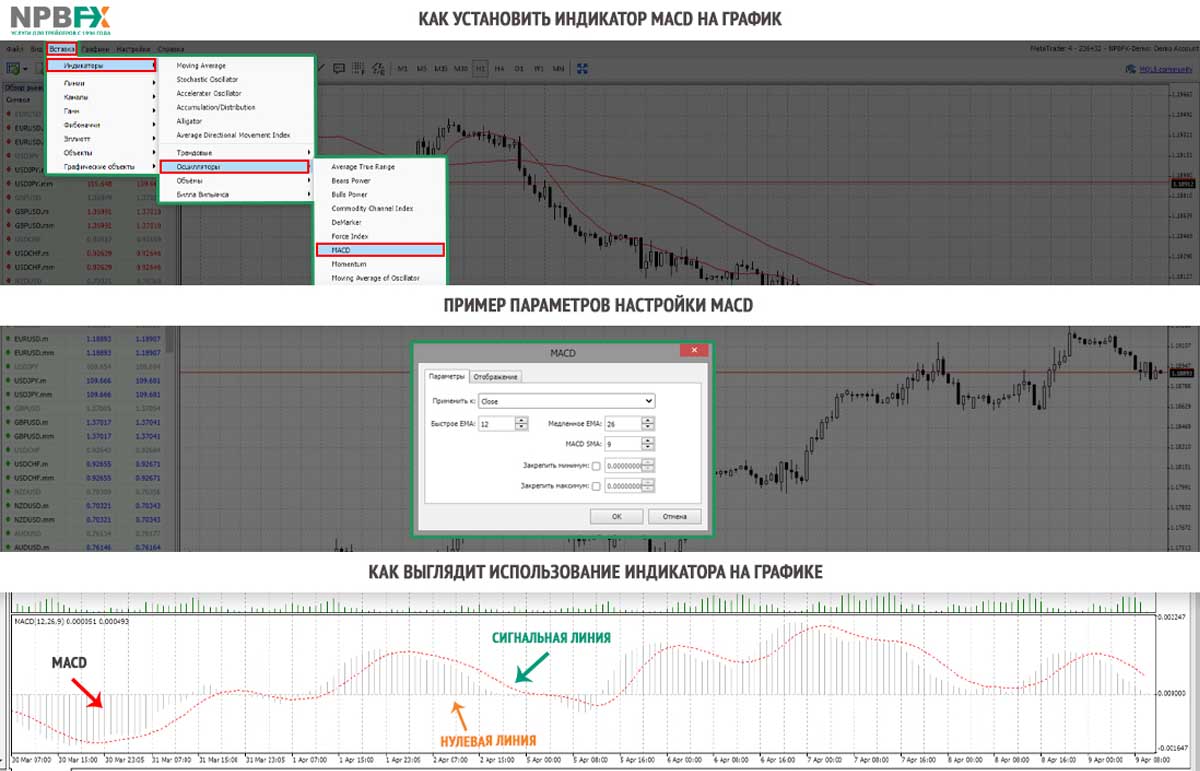
MACD indicator
There are indicators that combine the characteristics of both trend indicators and oscillators. These include MACD, which evaluates the convergence and divergence of two moving averages of different time periods. The greater the distance, the stronger the trend is. MACD also helps to determine the direction of the trend, it is another popular indicator among market professionals. When working with the indicator the signal line is a moving average (9). For other averages the periods 12 and 26 are used. Rules for working with MACD:
- If the MACD lines are above the zero line – the trend is upward, and vice versa.
- The uptrend could potentially continue with new strokes of greater magnitude.
- A divergence effect is possible, warning of a possible price reversal in the process of price formation of new tops, if the strokes MACD are at a lower elevation with respect to the previous peak.
This is not a complete list of available and useful indicators for forex trading. You can learn more about the possibilities of indicator trading on the Analytic Portal of NPBFX broker. Every client of the company can use the portal absolutely free – it is available after registering a personal account. NPBFX analytical portal – is a service where training materials are collected and analytics are regularly published. There is a collection of video tutorials including technical indicators, support and resistance levels and other important trading aspects. The “Education” section on the Analytics Portal includes more than 60 detailed articles on trading strategies, both with and without the use of indicators. For example, you will learn more about the following strategies here:
- Strategy with CCI and MACD oscillators.
- A strategy for GBP/JPY based on the Bollinger Bands.
- The strategy “ADX and Momentum”.
- The strategy “Heiken Ashi+ADX+Stochastic”.
- Strategy with indicators BB, MACD, MA, etc.
Study the materials available on the Analytical portal and choose the indicators to reach new heights on the Forex market. NPBFX broker will take care of creation of comfortable conditions for you – for more than 25 years the company has been working on expansion of the range of available assets, improvement of trading conditions and technical component. NPBFX trading conditions + indicators + profitable strategies = earnings in any market condition!
Reviews