Directions of Analysis in Trading: How to Choose and Use a Profitable Strategy
Contents
Today, there are many trading strategies used by traders all over the world. They are usually based on getting the signals that are needed to make trades. They depend on the chosen method of analyzing the market. There are 4 main directions of analysis. They can be used for trading on a binary options broker platform Pocket Option.

Candlestick
This method pays attention to patterns and individual candlesticks on the price chart. Combinations of candlesticks indicate a potential trend reversal or continuation. There are several strategies based on this type of analysis.
Trend reversal
A tactic that utilizes candlestick engulfment. Such a combination is a signal of reversal of the value movement in the other direction. It occurs when a candle with a larger body than the previous one appears. At the same time, such a candle is directed in the opposite direction. Such a candle absorbs another candle. When it appears, you should pay attention to where the next candle will go. In the case when it is directed in the same direction, where the absorption goes, after its closing you can make a deal.
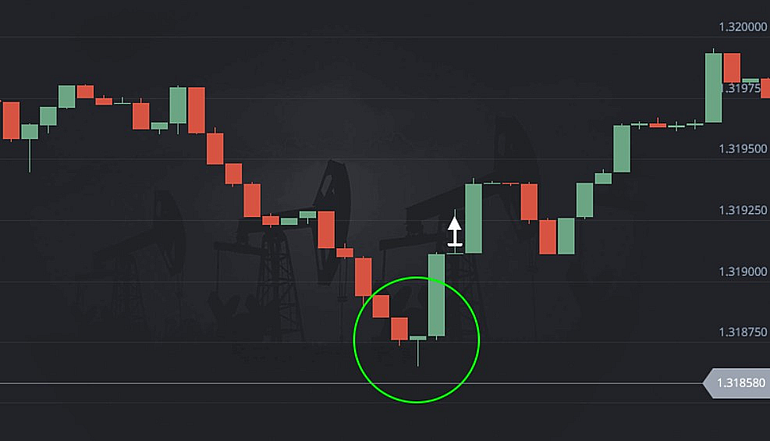
The use of a squat candle. Such candles with a small body and a long shadow can indicate a possible trend reversal. As a rule, its appearance on the chart indicates the market’s uncertainty in the direction of movement, which is at the moment. Such a candle can be one or several. When such a combination appears, it is necessary to get ready for a trend reversal.

Tweezers. The combination includes 2 candlesticks with different directions and equal minimum and maximum prices. When the trend is downward, the candlesticks have equal minima, when the trend is upward – maxima. The shadows of candlesticks or closing prices can act as minima and maxima. Candlesticks in a combination can follow each other or contain one or several candlesticks. The plus of the combination is that it gives a strong signal. The tweezers in other combinations strengthen its effect.
Trend continuation
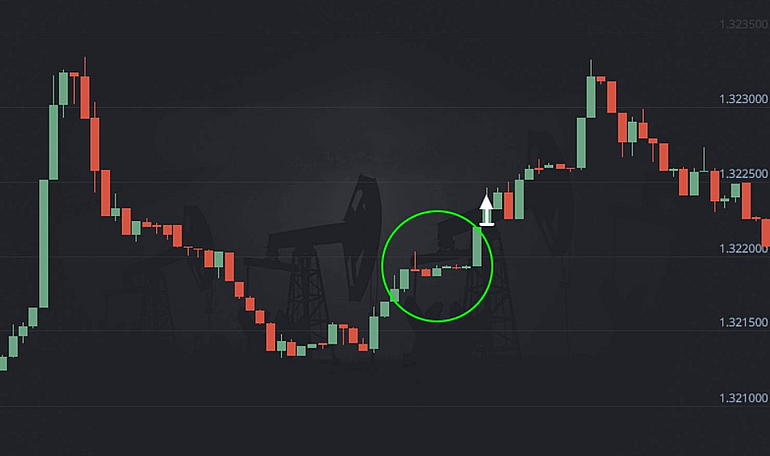
Three methods. A combination signaling the continuation of a trend. It appears at a pause in its development and consists of candles with a small body, which are formed after a long candle. The main sign of the combination is finding small candles within the values of the previous one. There should be at least three of them. The combination ends with a new long candle that continues the direction of the trend. After its closure, you can conduct a transaction.

Working with power levels
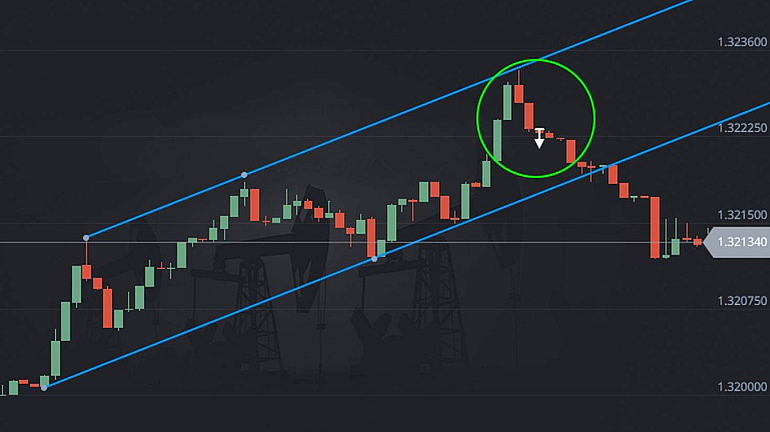
Power levels are places on the chart where the price can stop and turn in the opposite direction. For example, there are support and resistance levels, which mark local and historical extremes, trends and channel lines on the chart. If the price approaches support or resistance, a signal is given that it can stay near the level and turn in the opposite direction. There are 2 types of strategies with power levels – rebound and breakout.
To break the level
This strategy is based on the conclusion of a deal when the next candle closed on the other side of the level, breaking through it. The chart should continue moving in the same direction. It is necessary to conclude a deal when after crossing the level the next candle goes to the same place where the previous one went.
U-turn
According to this strategy deals are made after the price direction changes, while it is still near the power level. The signal is the inability of the candle to break through the level. It can touch its shadow or body. When the shadow passes the power level and closes in front of it, there is a signal that the price is not able to overcome it. This signal is confirmed by the next candle, which is directed opposite from the level.
Breaking through resistance and support lines, or bouncing off of them, provide good entry signals. They can be strengthened or weakened by combinations of candlestick analysis, which provides more opportunities for successful trades.

Computer
Computer analysis – different research methods for predicting the price movement of an asset. Using it, the historical data of the asset is necessarily taken into account. Trend indicators allow you to classify the direction of price movement and determine its strength, which helps to enter the market in time and get a good income. In computer analysis, several signals and indicators are used.
Moving average
The signal of trend change is the crossing of the chart at the level of the moving average. The signal of trend continuation is a bounce from its level. The indicator is used as a support or resistance level depending on where the price is located in relation to it. To get such signals, it is necessary to use moving averages with a large period. It should be understood that the period of the indicator for different trading instruments will be selected individually.
Bollinger Lines
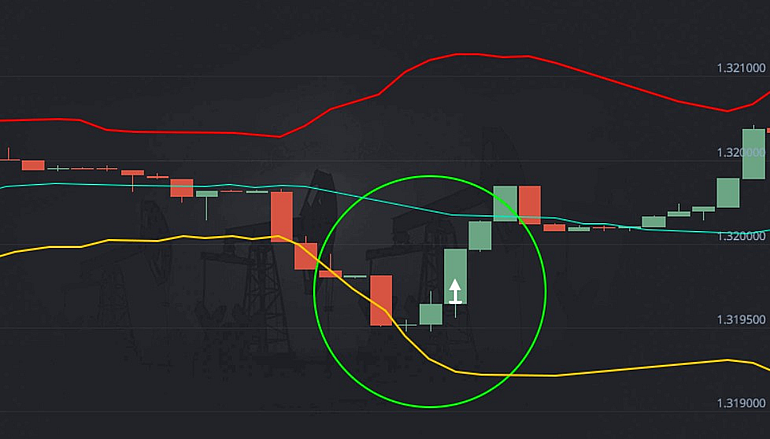
They are quite easy to use and can become a substitute for trend channels, as this indicator shows the range of price changes, where it moves most of the time. When working with Bollinger lines as a signal, you should use the moments when the price goes beyond the indicator’s boundary. In case of a sharp exit, the price tends to return to the center of the indicator.

Alligator
This is an indicator that indicates the beginning of a trend, but it is not recommended to use it as the main indicator, as it rarely gives signals to open trades. Alligator can be used as support and resistance lines.
Indicators are not bad aides in trading. They make it possible to analyze the situation faster and make timely decisions on opening a deal in a suitable direction. The computer calculates parameters automatically, takes into account historical data and gives ready-made signals. But in this case you need to properly adjust the indicator for different trading instruments.
Trading on the news
The market reacts to significant events depending on the level of significance. After the publication of news, the price of an asset may change. A trading strategy taking into account this information is considered risky, but it gives the opportunity to make substantial profits very quickly.
Money Management
In addition to basic analysis, one should know money management strategies. This is important for a trader who wants to achieve a stable income. The best strategy is loss tracking. It is necessary to initially determine the level of possible losses, at which you should stop and take a closer look at the strategy, as it may be ineffective.
Conclusion
It is important for beginners to understand the basics of trading in the financial market. There are many variants and combinations of popular strategies and analysis techniques. Any strategy requires detailed study and practicing skills on a demo account. It is also important to use the rules of money management, regardless of the choice of strategy. On the website of the binary options broker Pocket Option There is not only an opportunity to trade, but also a lot of useful information about strategies and indicators. It can be studied before you start trading on a real account.
Reviews